


BROSSARD, Quebec, Aug. 12, 2026 (GLOBE NEWSWIRE) — G Mining Ventures Corp. (“GMIN” or the “Corporation”) (TSX: GMIN, OTCQX: GMINF) today reported its financial and operating results for the second quarter ended June 30, 2026. Unless otherwise indicated, all dollar amounts are in U.S. dollars.
| Louis-Pierre Gignac, President and Chief Executive Officer, commented: “We delivered another strong quarter, with better-than-planned production and disciplined cost control driving robust margins and solid quarterly free cash flow (1)”. We remain on track to achieve full-year production guidance of 160,000 to 190,000 ounces of gold, with production expected to increase significantly in the second half of the year as we gain access to higher-grade phase 2 mineralization.
Our project pipeline continues to advance rapidly. At Oko, construction continues to advance on schedule and on budget, keeping us firmly on the path toward first gold pour in the second half of 2027, and Gurupi’s development roadmap continues to take shape. The acquisition of G2 Goldfields Inc. (“G2”) consolidates the Oko district into a globally significant tier-one gold mining complex in a world class geological district. |
Second Quarter 2026 Highlights
- Continued strong safety performance: GMIN recorded zero Lost Time Injuries across TZ, Oko and Gurupi during the quarter, maintaining a Total Recordable Injury Frequency Rate (“TRIFR”) of 0.00 for the quarter and 0.07 for the six months ended June 30, 2026.
- Solid operational quarter driven by strong execution and cost control: Tocantinzinho (“TZ”) delivered gold production of 36,845 ounces in the second quarter, a 16% increase over the first quarter of 2026 as mining sequencing continued to advance toward higher-grade Phase 2 mineralization. Total cash costs(1) of $1,046 per ounce sold were 1% higher than the first quarter, and All-In Sustaining Costs (“AISC”)(1) of $1,690 per ounce sold were 6% higher than the first quarter, largely driven by the stronger Brazilian real relative to the U.S. dollar. Second quarter gold sales totaled 37,439 ounce, an 11% increase over the first quarter of 2026 at an average realized price of $4,197 per ounce, generating quarterly revenues of $157.1 million.
- Strong quarterly free cash flow(1) generation: Solid operational performance together with continued strength in the gold price has translated into strong financial performance. The Corporation reported quarterly net income of $72.0 million or $0.30 per basic share and adjusted net income(1) of $79.1 million or $0.33 per basic share. Cash provided by operating activities totaled $103.8 million, or $0.44 per basic share, while free cash flow(1) reached $84.8 million, equivalent to $2,301 per ounce produced, or $0.36 per basic share.
- Continued investment: Capital expenditures totaled $158.5 million in the second quarter of 2026, comprising $10.6 million of sustaining capital, $8.3 million of capitalized stripping, $8.3 million of capitalized exploration expenditures and $131.3 million related to development activities at the Oko West Project (“Oko”).
- Strong Balance Sheet maintained through heavy growth capital expenditures: At June 30, 2026, cash and cash equivalents totaled $225.7 million and long-term debt was $33.0 million, resulting in a net cash position of $192.7 million.
Second Quarter and Six-Month 2026 Production and Costs
Production and Costs Results Summary
| Q2 2026 | Q2 2025 | H1 2026 | H2 2025 | ||
| In thousands of $, except as otherwise noted | |||||
| Operating Results | |||||
| Gold Produced | oz | 36,845 | 42,587 | 68,691 | 78,165 |
| Gold Sold | oz | 37,439 | 40,082 | 71,215 | 75,517 |
| Total Cash Costs per oz sold(1) | $/oz | 1,046 | 763 | 1,040 | 728 |
| AISC(1) | $/oz | 1,690 | 1,355 | 1,642 | 1,170 |
| Average Realized Gold Price(1) | $/oz | 4,197 | 3,233 | 4,171 | 3,014 |
Gold Production and Gold Sales
During Q2 2026, the Corporation sold 37,439 ounces of gold, consisting of 32,673 ounces sold into the spot market and 4,766 ounces delivered into the gold stream. Gold production in the second quarter was higher than planned, driven by a higher-grade sequence and stable mill performance. Gold recoveries in the mill improved to 91.9% in the quarter, up from 90.3% in Q1 2026. Plant feed grades averaged 1.23 grams per tonne (g/t) gold during the quarter, up from 1.03 g/t in Q1 2026
For the first six months of 2026, total gold sales were 71,215 ounces, comprised of 61,214 ounces sold into the spot market and 10,001 ounces delivered into the gold stream. Gold production in 2026 was in line with the planned processing of lower-grade ore in the first half of the year as mining focused on accelerated waste stripping and pit advancement to access higher-grade Phase 2 mineralization.
TZ achieved record quarterly mining of 6.3 million tonnes (Mt) in Q2 2026, a 15% increase over Q1 2026. The planned commissioning of additional haul trucks and a front-end loader in Q3 2026 is expected to further support increased mining rates. Mining activities remain closely aligned with the mine plan, enabling access to higher-grade Phase 2 mineralization and positioning the operation for a significant increase in grade and production during the second half of 2026 allowing for substantially lower costs, consistent with guidance. Stockpile rehandling and blending continued to support stable and consistent plant feed throughout the quarter.
Cost Performance
Cash costs (1) per ounce sold in the second quarter of 2026 was 37% higher when compared to the prior-year period due primarily to lower production volumes, higher royalties, and a stronger Brazilian real relative to the U.S. dollar.
AISC (1) per ounce in the second quarter of 2026 was 25% higher when compared to the prior-year period due to the reasons described above for the increase in total cash costs and higher general and administrative expenses.
The Corporation reported an AISC (1) margin of $2,330 per ounce of gold sold in the period, compared to $1,637 per ounce of gold sold in Q2 2025. Margins remained strong in the quarter, supported by the robust gold price environment and the Corporation’s low-cost operating profile. The low AISC (1) reflects, among other factors, the benefit of TZ’s low strip ratio, the comparatively low diesel consumption associated with TZ’s hauling activities, as well as the fact that the processing facility is entirely energized by Brazil’s low-cost renewable hydro-electric power. As a result, the Corporation has relatively low exposure to diesel price volatility, with a $10 per barrel change to the oil price estimated to have a $8 to $10 per ounce impact on AISC, depending on the movement of materials.
Reconciliation of Cash Costs (1) and AISC (1)(2)
| Q2 2026 | Q2 2025 | ||
| In thousands of $, except as otherwise noted | |||
| Operating Expenses | $ | 35,470 | 26,572 |
| Royalties | $ | 5,041 | 4,019 |
| Less: Realized Gain on Foreign Currency Contracts | $ | (1,362) | – |
| Total Cash Costs (1) | $ | 39,149 | 30,591 |
| Sustaining Capital and others* | $ | 19,272 | 19,358 |
| Site Level AISC (1) | $ | 58,421 | 49,949 |
| General and Administrative (“G&A”) Expenses ** | $ | 4,825 | 4,376 |
| Total AISC (1) | $ | 63,246 | 54,325 |
| Costs per oz: | |||
| Cash Costs (1) | $/oz | 1,046 | 763 |
| Site Level AISC (1) | $/oz | 1,561 | 1,246 |
| AISC (1) | $/oz | 1,690 | 1,355 |
*Comprised of Sustaining capital expenditures, capitalized stripping (sustaining), exploration (sustaining) and accretion of rehabilitation provision (ARO).
** This amount excludes corporate depreciation and amortization expenses totaling $118,000 for the three months ended June 30, 2026 ($38,000 for the three months ended June 30, 2025). This amount also excludes non-sustaining allocation of G&A Expenses totaling $303,000 for the three months ended June 30, 2026 (($629,000) for the three months ended June 30, 2025).
Second Quarter and Six-Month 2026 Financial Results(2)
| Q2 2026 | Q2 2025 | H1 2026 | H1 2025 | ||
| In thousands of $, except as otherwise noted | |||||
| Financial Results | |||||
| Revenue | $ | 157,125 | 129,594 | 297,063 | 227,612 |
| Cash generated from operating activities | $ | 103,835 | 79,767 | 173,541 | 110,291 |
| Cash generated from operating activities | $/share(3) | 0.44 | 0.35 | 0.74 | 0.49 |
| Free Cash Flow(1) | $ | 84,773 | 60,534(4) | 140,944 | 86,002(4) |
| Free Cash Flow(1) | $/share(3) | 0.36 | 0.27 | 0.60 | 0.38 |
| Net Income | $ | 71,957 | 48,626 | 152,327 | 73,055 |
| Net Income | $/share(3) | 0.30 | 0.21 | 0.65 | 0.32 |
| Adjusted Net Income(1) | $ | 79,150 | 36,502 | 141,193 | 71,477 |
| Adjusted Net Income(1) | $/share(3) | 0.33 | 0.16 | 0.60 | 0.32 |
| EBITDA(1) | $ | 106,935 | 104,258 | 221,015 | 170,972 |
| Adjusted EBITDA(1) | $ | 113,727 | 92,851 | 211,399 | 160,987 |
| Capital Expenditures (sustaining)(1) | $ | 19,062 | 19,233 | 32,597 | 24,289 |
| Capital Expenditures (growth)(1)(5) | $ | 139,592 | 28,923 | 233,683 | 38,406 |
| June 30, 2026 | December 31, 2025 | ||
| In thousands of $, except as otherwise noted | |||
| Financial Position | |||
| Cash and Cash Equivalents | $ | 225,734 | 134,548 |
| Long-Term Debt | $ | 33,019 | 141,440 |
| Net (Debt) Cash | $ | 192,715 | (6,892) |
Revenue
Revenue of $157.1 million in the second quarter was generated on 37,439 ounces of gold sold at a record average realized gold price of $4,197 per ounce, up from $4,143 per ounce in the first quarter of 2026. For the six months ended June 30, 2026, revenue was $297.1 million on 71,215 ounces sold at an average realized gold price of $4,171 per ounce.
Net Income and Adjusted Net Income (1)
Net income of $72.0 million ($0.30 per share) and adjusted net income (1) of $79.1 million ($0.33 per share) were reported for the second quarter of 2026, compared to net income of $48.6 million ($0.21 per share) and adjusted net income (1) of $36.5 million ($0.16 per share) in the second quarter of 2025. Adjusted net income (1) for the quarter excludes a $1.4 million unrealized foreign exchange loss; a $4.9 million loss on the change in fair value of financial instruments; a $0.4 million deferred income tax expense and a $0.5 million present value adjustment on Value-Added Tax (“VAT”) receivables.
For the six months ended June 30, 2026, reported net income was $152.3 million or net income of $0.65 and $0.64 per share on a basic and diluted basis, respectively. Adjusted net income(1) was $141.2 million or $0.60 per share on a basic and diluted basis.
EBITDA (1) and Adjusted EBITDA (1)
The Corporation generated EBITDA (1) of $106.9 million and adjusted EBITDA (1) of $113.7 million for the three months ended June 30, 2026. For the six months ended June 30, 2026, EBITDA (1) was $221.0 million and adjusted EBITDA (1) was 211.4 million.
| Q2 2026 | Q2 2025 | |
| In thousands of $, except as otherwise noted | ||
| Net Income | 71,957 | 48,626 |
| Finance Expense | 2,397 | 5,685 |
| Depreciation and Depletion | 14,024 | 13,764 |
| Current and Deferred Tax Expense | 18,557 | 36,183 |
| EBITDA(1) | 106,935 | 104,258 |
| Adjustments: | ||
| Unrealized Foreign Exchange Loss | 1,367 | (3,524) |
| Change in Fair Value of Financial Instruments | 4,918 | (7,883) |
| Present Value Adjustment of VAT Receivable | 507 | – |
| Adjusted EBITDA(1) | 113,727 | 92,851 |
Cash Provided by Operating Activities
Cash provided by operating activities totaled $103.8 million in the second quarter of 2026, compared to $79.8 million in the second quarter of 2025. The cash inflows were higher in 2026 mainly due to the higher gold price compared to the same period last year partially offset by lower ounces of gold sold and higher operating costs due to lower grade processed.
For the first six months of 2026, cash provided by operating activities totaled $173.5 million, compared to $110.3 million for the six months ended June 30, 2025. The cash inflows were higher in 2026 mainly due to the higher gold price compared to the same period last year partially by lower ounces of gold sold; higher operating costs due to lower grade processed and current income taxes paid for the year 2025.
Free Cash Flow(1)
Free cash flow (1) in the second quarter of 2026 increased over both the first quarter of 2026 and the prior-year period, primarily for the reasons described above related to cash provided by operating activities. The Corporation generated quarterly free cash flow (1) of $84.8 million, or $0.36 per share, highlighting the asset’s strong margin profile and ability to fund growth internally. For the first six months of 2026, free cash flow(1) was $140.9 million, or $0.60 per share.
Capital Expenditures
Capital expenditures totalled $158.5 million in the second quarter of 2026, comprising of $10.6 million of sustaining capital, $8.3 million of capitalized waste stripping, $8.3 million of capitalized exploration expenditures and $131.3 million related to development activities at Oko.
For the first six months of 2026, capital expenditures totalled $266.2 million, comprising of $12.9 million of sustaining capital, $18.9 million of capitalized waste stripping, $0.8 million of sustaining exploration, $13.8 million of capitalized exploration expenditures and $219.8 million related to development activities at Oko.
2026 & 2027 Outlook
Gold production of 68,691 ounces of gold for the first six months of 2026 was in line with the planned processing of lower-grade ore in the first half of the year as mining activities focused on accelerated waste stripping and pit advancement to access high-grade Phase 2 mineralization. The Corporation maintains its 2026 production guidance of 160,000 to 190,000 ounces, with approximately 61% of output expected in the second half of 2026 as higher-grade material is accessed in accordance with the mine plan. Higher production and lower unit costs are expected to drive stronger free cash flow (1) through the remainder of the year.
Cash Costs(1) and AISC (1) guidance for the full year 2026 have been revised to $836–$965 and $1,330–$1,544 per ounce sold, respectively, up from previous guidance of $736–$865 and $1,230–$1,444 per ounce sold, respectively.
The increase in Cash Costs (1) and AISC (1) guidance reflects several factors, including: the continued strength of the Brazilian real (BRL:USD assumption of 5.15, versus 5.55 previously); labor cost inflation in Brazil; continued investment in maintenance; and higher assumed gold prices, which increase royalty costs ($4,300/oz, versus $4,000/oz previously).
Total capital expenditures guidance for 2026 (excluding capitalized exploration) remains unchanged at $583 to $649 million, comprising of $38 to $45 million sustaining capital expenditures, $31 to $36 million of capitalized waste stripping and $514 to $568 million related to development activities at Oko. Capital exploration guidance for 2026 remains unchanged at $42 to $50 million.
Full year guidance for 2027 for production, costs and capital expenditures remains unchanged.
| Operational and Cost Guidance | H1 2026 Actuals |
2026(6) Guidance |
2027(6) Guidance |
|
| In thousands of $, except as otherwise noted | ||||
| Gold Production | k oz | 69 | 160 – 190 | 200 – 235(7) |
| Total Cash Costs(1) | $/oz Au | 1,040 | 836 – 965 was 736 – 865 |
633 – 743 |
| Site-Level AISC(1) | $/oz Au | 1,504 | 1,233 – 1,430 was 1,133 – 1,330 |
898 – 1,054 |
| AISC(1) | $/oz Au | 1,642 | 1,330 – 1,544 was 1,230 – 1,444 |
977 – 1,146 |
| Sustaining Capital Expenditures | ||||
| Sustaining | $ | 13 | 38 – 45 | 19 – 23 |
| Capitalized Stripping | $ | 19 | 31 – 36 | 43 – 51 |
| Exploration (Sustaining) | $ | 1 | – | – |
| Total Sustaining Capital Expenditures | $ | 33 | 69 – 81 | 62 – 74 |
| Non-Sustaining Capital Expenditures(8) | ||||
| TZ Exploration | $ | 3 | 8 – 10 | 8 – 10 |
| Oko West Exploration | $ | 5 | 15 – 17 | 14 – 18 |
| Gurupi Exploration | $ | 6 | 19 – 23 | 18 – 22 |
| Total Exploration | $ | 14 | 42 – 50 | 40 – 50 |
| Oko West Project Development | $ | 219 | 514 – 568 | 217 – 240 |
| Total Non-Sustaining Capital Expenditures | $ | 233 | 556 – 618 | 257 – 290 |
Advancing the Next Phase of Transformational Growth
Oko – More than 2.3 million person-hours have been worked at Oko, with over 1,700 employees and contractors currently on site, 77% of whom are Guyanese nationals. As of June 30, 2026, overall project progress at Oko had reached 28.0% based on earned value, with construction advancing on schedule across key work areas, including the process plant, power plant, tailings storage facility and site infrastructure.
As of June 30, 2026, $423 million had been spent on the Project, representing 44% of the approved initial capital budget of approximately $973 million, with approximately $550 million remaining to be spent through completion. Total commitments reached approximately $628 million, or 65% of the approved budget. 2026 represents the peak construction year, with expected project spending of $514 to $568 million, of which $219 million was spent during the first half of the year.
Detailed engineering is approximately 90% complete and is expected to conclude in the third quarter of 2026, while procurement had reached approximately 99% completion as of the end of June 2026. Key achievements in the process plant area during the quarter included continued concrete pours across the power plant, SAG and ball mill foundations, primary crusher, CIL/CIP tanks and pre-leach thickener. Other key infrastructure workstreams also advanced, including the permanent camp, which now has more than 1,400 beds available, with the welcome centre, kitchen and dining hall operational.
Construction remains on schedule, with first gold pour targeted for the second half of 2027 and commercial production expected in early 2028.
G2 Transaction Completed – The completion of the G2 acquisition creates a tier-one gold asset with potential to deliver substantially increased average annual gold production over the life of mine (LOM) once the expansion is completed, further elevating GMIN’s industry-leading near-term growth profile (see GMIN news release dated July 29, 2026). The Corporation will launch an integration program aimed at advancing the Oko-Ghanie deposits through infill drilling to support an integrated mineral resource estimate (“MRE”) and an updated feasibility (“FS”) for an expanded Oko Gold Project. Complementary technical programs, including metallurgical, geotechnical, and other engineering studies, will also commence in the second half of the year to support the integrated project development.
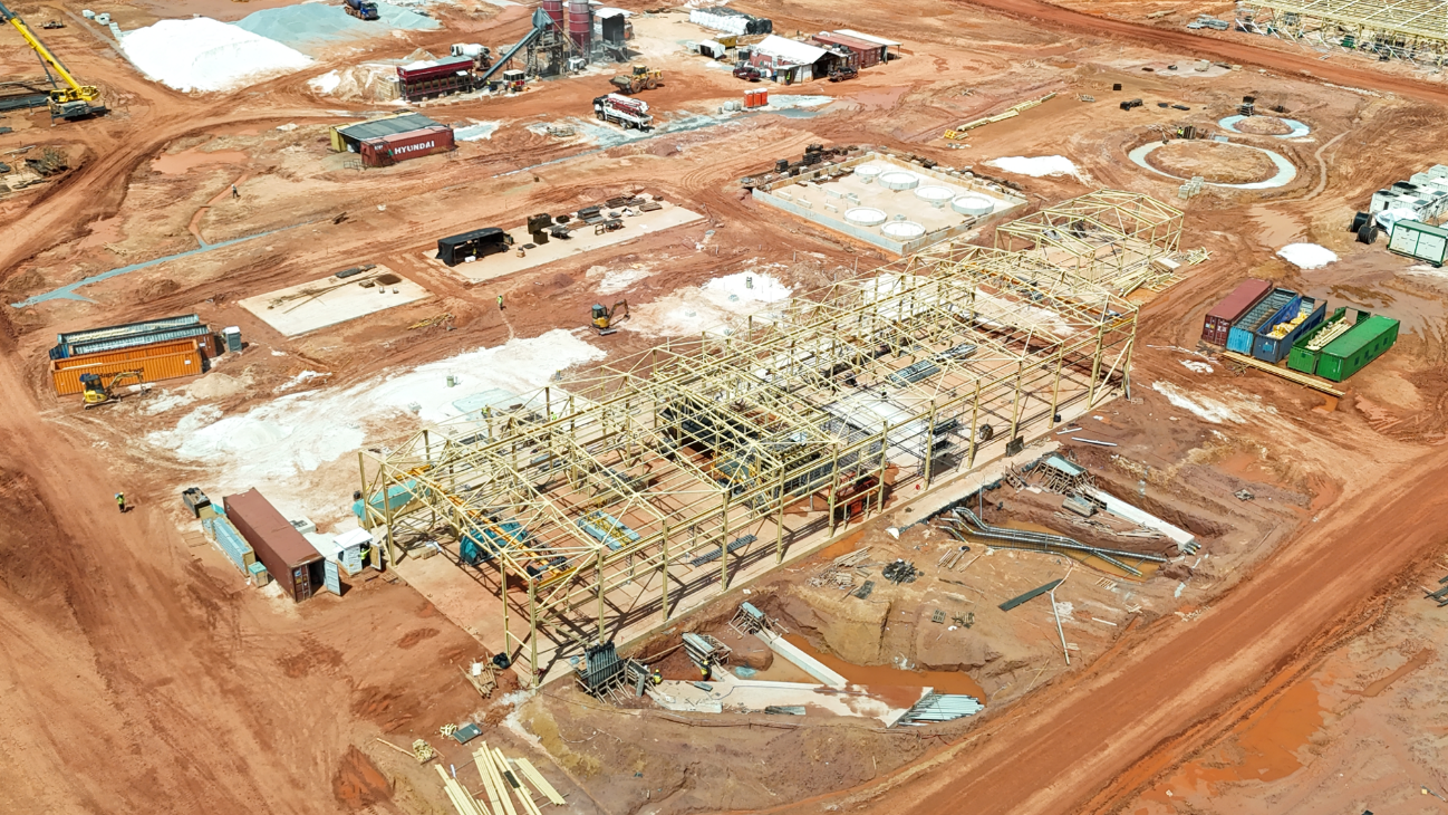
Oko Construction Progress – Below are photos highlighting recent construction progress at Oko:
The power plant continues to advance with over 1,350 m3 of concrete poured to date and the structural steel framing for the engine hall complete. Day tank and stack foundations are also complete while cable tray and electrical are currently being installed. Fuel treatment building (right) has completed framing.
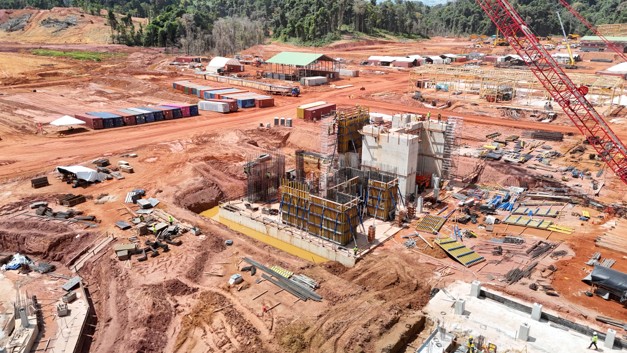
The SAG mill foundation is completed with anchor bolts and embedded plates. The first concrete pour for the ball mill foundation will take place in August.

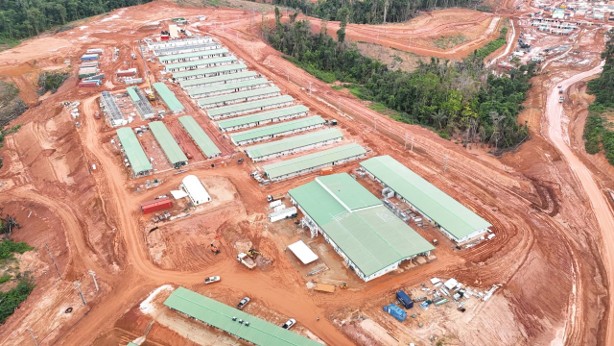
The permanent camp has over 1,400 beds, with the welcome centre, kitchen & dining hall all operational and open to employees.
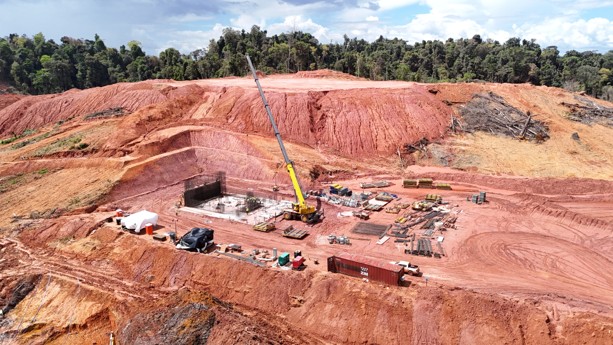
The primary crusher has advanced significantly with the mat foundation concrete pour completed. The rebar and concrete pours of the first level will commence in August.
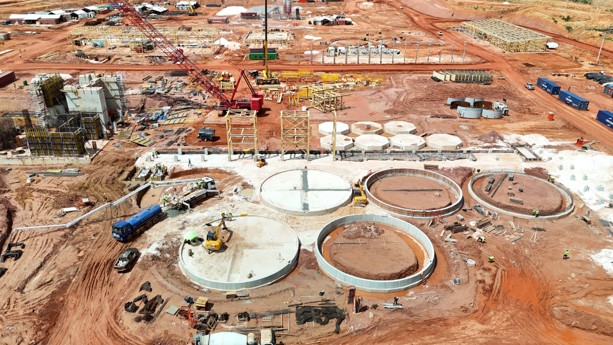
Excavation has been completed for five CIL tanks, with construction of two inner rings advancing. Foundations for all seven CIP tanks have been completed, with tank installation scheduled to commence in August. The photo also shows the commencement of the pipe rack structure.
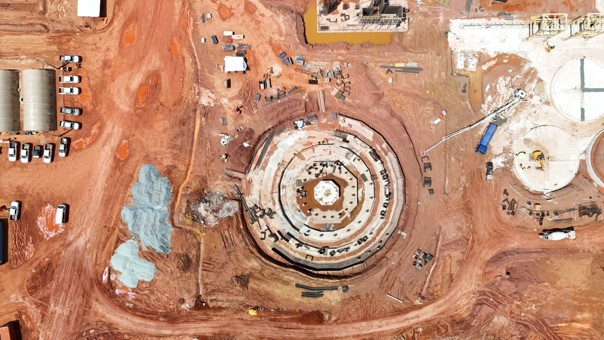
Construction of exterior rings two and three on our pre-leach thickener are more than halfway complete while ring four is being prepared to be poured in August. This work is in tandem with the associated piers.
Gurupi’s Development Roadmap Taking Shape – GMIN plans to invest between $19 million and $23 million in exploration in 2026 to grow the resource base through both brownfield and greenfield programs, with the goal of delivering an MRE and a preliminary economic assessment (“PEA”) in the second half of 2026. Alongside the exploration program, environmental and social baseline studies are advancing in support of an Environmental and Social Impact Assessment (“ESIA”) submission targeted for the fourth quarter of 2026.
Second Quarter 2026 Exploration Activities
During the second quarter of 2026, the Corporation advanced exploration across its three key properties, with first-half expenditures totaling $13.8 million ($2.6 million at TZ, $4.8 million at Oko, and $6.4 million at Gurupi), and full-year guidance maintained as activity is set to accelerate following the closing of the G2 transaction. At TZ, drilling tested depth extensions within the pit and advanced regional targets along the main structural trend, including Toca-Toca, North Airstrip, Arara Azul, and the newly initiated Santa Patricia target, reinforcing a strategy centered on mine life extension.
At Oko, drilling focused on the Lukanani target with nearly 9,900 metres completed, while the Corporation prepares to launch an integration program combining infill drilling and technical studies to support an updated feasibility study for an expanded, integrated Oko-Ghanie project.
At Gurupi, five drill rigs tested the northern extension of the Chega Tudo deposit and advanced the Grodiacol, Mandiocal, and Cipoeiro targets, supported by extensive soil sampling and trenching, with results expected to feed into resource growth and a year-end PEA.
With pending assay results expected shortly, the Corporation anticipates providing an exploration update highlighting significant results during the third quarter of 2026.
Environmental, Social & Governance (ESG)
Key ESG accomplishments during the quarter included the publication of the 2025 Sustainability Report, continued implementation of its health, safety, environment, and community management platform, advancement of corporate Environmental and Social Performance Standards, and the development of action plans associated with human rights, security, tailings management, and operational assurance programs. From the permitting perspective, TZ achieved important milestones during the quarter. The Installation License for the Tailings Storage Facility (“TSF“) raise to elevation 161 was issued in June 2026 and this represents 2 more years of tailing disposal at the TSF.
During the quarter, the Corporation continued developing its Environmental and Social Performance Standards, which will establish minimum operational requirements across all assets and create a consistent framework for environmental management, social performance, community relations, human rights, and governance practices. Completion of these standards are targeted for H2 2026 and is expected to further strengthen accountability and performance consistency across the portfolio.
GMIN also made significant progress strengthening operational management systems, which is expected to standardize incident management, inspections, corrective actions, and performance reporting while providing enhanced visibility and governance oversight across all operations.
Overall, the Corporation’s ESG activities during 2026 remain focused on strengthening governance systems like the achievement of 71% alignments with TSM for TZ, improving transparency, enhancing operational assurance, and embedding consistent environmental and social management practices capable of supporting long-term growth across multiple assets and jurisdictions.
Second Quarter 2026 Financial and Operating Results Conference Call and Webcast
A conference call to discuss details of GMIN’s 2026 second quarter financial and operational results will be held by senior management on Thursday, August 13, 2026, at 9:00 AM (ET). Participants may join the conference call using the following details:
Conference ID: 5586985
- Toll-Free (North America): 1 (800) 715-9871
- International: 1-646-307-1963
- Webcast Link: https://edge.media-server.com/mmc/p/kanuh99v
The conference call will also be accessible through the GMIN investor relations website at:
https://investors.gmin.gold/English/events-and-presentations/default.aspx
A replay of the webcast will be available for 12 months following the call. Replay details will be posted to the GMIN website within 24 hours of the call at https://investors.gmin.gold/English/events-and-presentations/default.aspx.
Qualified Person
Louis-Pierre Gignac, President & Chief Executive Officer of GMIN, a QP as defined in NI 43-101, has reviewed the press release on behalf of the Corporation and has approved the technical disclosure contained in this press release.
About G Mining Ventures Corp.
G Mining Ventures Corp. is a mining company engaged in the development, operation and exploration of precious metals projects. GMIN is well-positioned to grow into the next mid-tier precious metals producer by leveraging strong access to capital and proven development expertise. GMIN is currently anchored by the Tocantinzinho Mine in Brazil, supported by the Gurupi Project in Brazil and the Oko West Project and Oko-Ghanie Project in Guyana — all with significant exploration upside and located in mining-friendly jurisdictions. GMIN trades on the TSX under the symbol GMIN.
Additional Information
For further information on GMIN, please visit the website at www.gmin.gold or contact:
Jean-François Lemonde
Vice President, Investor Relations
514.299.4926
Jflemonde@gmin.gold
Cautionary Statement on Forward-Looking Information
All statements, other than statements of historical fact, contained in this press release constitute “forward-looking information” and “forward-looking statements” within the meaning of certain securities laws and are based on expectations and projections as of the date of this press release. While this press release focuses on results from the 2026 second quarter’s activities, it also provides information about the production and cost guidance for TZ, the capital expenditures guidance at Oko, the advancement of Oko construction (including new perspectives thereat ensuing from the G2 acquisition and the eventual integration of G2’s Oko-Ghanie), the exploration strategy and the planned exploration works across the organization (notably management’s expectations to maintain its 2026 exploration guidance and to provide an update highlighting significant results in Q3-2026), the milestones expected to be achieved at Gurupi (e.g., PEA, ESIA), and the expected strategic, financial and operational advantages from the G2 acquisition, all such information being forward-looking in its essence and nature.
Forward-looking statements contained in this press release include, without limitation, those related to (i) the gold production at TZ being expected to increase in H2-2026; (ii) TZ costs and free cash flow being expected to improve in H2-2026; (iii) mining sequencing at TZ being expected to continue to advance toward higher grade mineralization (the grade being expected to increase in H2-2026); (iv) the annual production and cost guidance for 2026-2027 at TZ as well as the capital expenditures guidance for Oko remaining unchanged; (v) the expected strategic, financial and operational benefits of the G2 acquisition; (vi) the commitments as well as the projected capital expenditures for the remainder of 2026; (vii) the construction at Oko advancing on schedule and on budget; (viii) the G2 acquisition being expected to further elevate GMIN’s industry-leading near term growth profile; (ix) GMIN’s exploration plans at Gurupi and the expected growing mineral resources thereat, with an updated MRE and a PEA in H2-2026 while the ESIA is targeted for submission in Q4-2026; (x) the planned commissioning of additional equipment at TZ being expected to support increase mining rates; (xi) gold production at TZ being estimated between 200,000 and 235,000 ounces in 2027; (xii) detailed engineering at Oko to be completed in Q3-2026; (xiii) the updated feasibility study for an expanded Oko project (i.e., integrating G2’s Oko-Ghanie); (xiv) the completion of ESG standards being targeted for H2-2026; (xv) the quoted comments and expectations of GMIN’s President & Chief Executive Officer; and (xvi) more generally, the whole contents of the sections entitled “Advancing the Next Phase of Transformational Growth”, “G2 Transaction Completed”, “Gurupi’s Development Roadmap Taking Shape”, “2026 and 2027 Outlook” and “About G Mining Ventures Corp.”.
Forward-looking statements are based on expectations, estimates and projections as of the time of this press release. Forward-looking statements are necessarily based upon several estimates and assumptions that, while considered reasonable by the Corporation as of the time of such statements, are inherently subject to significant business, economic and competitive uncertainties and contingencies. These estimates and assumptions may prove to be incorrect. Such assumptions include, without limitation, those relating to GMIN’s industry-leading near term growth profile, those relating to GMIN continuing to generate strong free cash flow and strong profitability, those relating to the price of gold (in particular, its anticipated continued strength), and currency exchange rates, those outlined in the feasibility and other technical studies relating to GMIN’s mining assets, those relating to government royalties, taxes (including tax incentives) and withholdings, and those underlying the items listed on the above sections entitled “Advancing the Next Phase of Transformational Growth”, “G2 Transaction Completed”, “Gurupi’s Development Roadmap Taking Shape”, “2026 and 2027 Outlook” and “About G Mining Ventures Corp.”.
Many of these uncertainties and contingencies can directly or indirectly affect, and could cause, actual results to differ materially from those expressed or implied in any forward-looking statements. There can be no assurance that, notably but without limitation, (i) the G2 acquisition will transform Oko into a globally significant Tier-One gold asset; (ii) GMIN’s integration program for G2’s Oko-Ghanie will meet expectations; (iii) TZ will continue operating at steady state, enabling it to improve productivity; (iv) TZ will deliver production, recoveries and costs that will enable GMIN to maintain itsr exceed 2026 production guidance and meet its revised 2026 cash costs and AISC guidance, as well as its overall 2027 guidance; (v) advancement of Oko will remain fully funded through construction, commissioning and ramp-up to commercial production, and will remain on schedule and within budget (in particular, detailed engineering and procurement will be completed in Q3-2026); (vi) GMIN’s positive safety and environmental records will remain stable and continue over time; (vii) the expected benefits of the G2 acquisition will ever materialize; (viii) GMIN will meet guidance, even if it was reiterated above; (ix) any of GMIN’s exploration activities at TZ, Oko West and Gurupi will generate positive results, which will in turn lead to additional resources and reserves, and eventually to additional gold production; (x) Oko will deliver first gold pour in H2-2027 and will achieve commercial production in early 2028, or at all; (xi) GMIN will achieve all or any of the milestones contemplated for 2026 at Gurupi (e.g., PEA, ESIA); or (xii) GMIN will use TZ and Oko West to grow into the next mid-tier precious metals producer, as future events could differ materially from what is currently anticipated by the Corporation. In addition, there can be no assurance that Brazil and/or Guyana will remain mining friendly and prospective jurisdictions.
By their very nature, forward-looking statements involve inherent risks and uncertainties, both general and specific, and risks exist that estimates, forecasts, projections and other forward-looking statements will not be achieved or that assumptions do not reflect future experience. Forward-looking statements are provided for the purpose of providing information about management’s expectations and plans relating to the future. Readers are cautioned not to place undue reliance on these forward-looking statements as several important risk factors and future events could cause the actual outcomes to differ materially from the beliefs, plans, objectives, expectations, anticipations, estimates, assumptions and intentions expressed in such forward-looking statements. All of the forward-looking statements made in this press release are qualified by these cautionary statements and those made in the Corporation’s other filings with the securities regulators of Canada including, but not limited to, the cautionary statements made in the relevant sections of the Corporation’s (i) Annual Information Form dated March 25, 2026, for the financial year ended December 31, 2025, and (iii) Management Discussion & Analysis. The Corporation cautions that the foregoing list of factors that may affect future results is not exhaustive, and new, unforeseeable risks may arise from time to time. The Corporation disclaims any intention or obligation to update or revise any forward-looking statements or to explain any material difference between subsequent actual events and such forward-looking statements, except to the extent required by applicable law.
Consolidated Statements of Financial Position
(Unaudited -Tabular amounts expressed in Thousands of United States Dollars)
| June 30, 2026 |
December 31, 2025 |
|
| $ | $ | |
| Assets | ||
| Current | ||
| Cash and Cash Equivalents | 225,734 | 134,548 |
| Receivables and Other Current Assets | 8,788 | 8,670 |
| Inventories | 73,679 | 65,450 |
| Income Tax Recoverable | – | 6,067 |
| 308,201 | 214,735 | |
| Non-current | ||
| Deferred Financing Fees | 3,758 | 4,421 |
| Inventories | 57,844 | 46,557 |
| Long Term Deposits on Equipment | 34,862 | 42,121 |
| Property, Plant & Equipment and Mineral Property | 1,715,087 | 1,484,350 |
| Intangible Assets | 29,454 | 30,675 |
| Exploration & Evaluation Assets | 37,753 | 23,868 |
| Income Tax Recoverable | 307 | 3,928 |
| Investment in Associates | 15,853 | 3,283 |
| Other Non-current Assets | 73,547 | 43,794 |
| 2,276,666 | 1,897,732 | |
| Liabilities | ||
| Current | ||
| Accounts Payable and Accrued Liabilities | 76,164 | 68,390 |
| Income Tax Payable | 27,532 | 25,671 |
| Current Portion of Contract Liability | 39,598 | 34,822 |
| Current Portion of Long-term Debt | 7,468 | 17,616 |
| 150,762 | 146,499 | |
| Non-current | ||
| Long-term Contract Liability | 191,910 | 195,326 |
| Long-term Debt | 25,551 | 123,824 |
| Deferred Tax Liability | 577 | 2,095 |
| Rehabilitation Provision | 13,540 | 8,875 |
| Other Long-term Liability | 6,044 | 2,681 |
| 237,622 | 332,801 | |
| Shareholders’ Equity | ||
| Share Capital | 1,419,824 | 1,101,228 |
| Share-based Payments Reserve | 13,399 | 13,191 |
| Accumulated Other Comprehensive Income | 154 | 179 |
| Retained Earnings | 454,905 | 303,834 |
| 1,888,282 | 1,418,432 | |
| 2,276,666 | 1,897,732 | |
Refer to Q2 2026 Financial Statements for accompanying notes
Consolidated Statements of Income
(Unaudited – Tabular amounts expressed in Thousands of United States Dollars, except for number of shares)
| Three Months Ended June 30, | Six Months Ended June 30, | |||
| 2026 | 2025 | 2026 | 2025 | |
| $ | $ | $ | $ | |
| Revenue | 157,125 | 129,594 | 297,063 | 227,612 |
| Cost of Goods Sold | (54,417) | (44,317) | (103,879) | (82,450) |
| Income from Mining Operations | 102,708 | 85,277 | 193,184 | 145,162 |
| Other Expenses | ||||
| General & Administrative Expenses | 5,246 | 3,785 | 10,607 | 9,304 |
| Finance Expense | 2,397 | 5,685 | 5,384 | 11,435 |
| Change in Fair Value of Financial Instruments | 4,918 | (7,883) | (20,099) | (8,300) |
| Foreign Exchange | 14 | (151) | 7,203 | 2,325 |
| Other (Income) Expenses | (381) | (968) | 1,931 | (1,627) |
| 12,194 | 468 | 5,026 | 13,137 | |
| Income Before Income Tax | 90,514 | 84,809 | 188,158 | 132,025 |
| Current and Deferred Income Tax Expense | (18,557) | (36,183) | (35,831) | (58,970) |
| Net Income for the Period | 71,957 | 48,626 | 152,327 | 73,055 |
| Net Income per Share | ||||
| Basic | 0.30 | 0.21 | 0.65 | 0.32 |
| Diluted | 0.30 | 0.21 | 0.64 | 0.32 |
| Weighted Average Number of Common Shares | ||||
| Basic | 237,765,578 | 226,205,719 | 234,084,566 | 225,735,715 |
| Diluted | 240,927,791 | 229,868,055 | 237,254,062 | 229,191,425 |
Refer to Q2 2026 Financial Statements for accompanying notes
Consolidated Statements of Comprehensive Income
(Unaudited – Tabular amounts expressed in Thousands of United States Dollar)
| Three Months Ended June 30, | Six Months Ended June 30, | |||
| 2026 | 2025 | 2026 | 2025 | |
| $ | $ | $ | $ | |
| Net Income for the Period | 71,957 | 48,626 | 152,327 | 73,055 |
| Currency Translation Adjustment | (642) | 72,178 | (25) | 110,322 |
| Comprehensive Income for the Period | 71,315 | 120,804 | 152,302 | 183,377 |
Refer to Q2 2026 Financial Statements for accompanying notes
Consolidated Statements of Cash Flows
(Unaudited – Tabular amounts expressed in Thousands of United States Dollars, except for number of shares)
| Three Months Ended June 30, | Six Months Ended June 30, | |||
| 2026 | 2025 | 2026 | 2025 | |
| $ | $ | $ | $ | |
| Operating Activities | ||||
| Net Income for the Period | 71,957 | 48,626 | 152,327 | 73,055 |
| Items Not Involving Cash | 18,192 | (2,865) | 22,920 | 12,807 |
| Current Income Taxes Expense | 18,156 | 36,900 | 37,349 | 50,563 |
| Current Income Taxes Paid | (2,886) | (8,099) | (36,236) | (25,416) |
| 105,419 | 74,562 | 176,360 | 111,009 | |
| Changes in Operating Assets and Liabilities | ||||
| Receivables and Other Assets | (10,851) | (1,544) | (10,874) | (8,514) |
| Inventories | (11,545) | (6,454) | (16,527) | (17,285) |
| Accounts Payable and Accrued Liabilities | 20,812 | 13,203 | 24,582 | 25,081 |
| Cash Provided by Operating Activities | 103,835 | 79,767 | 173,541 | 110,291 |
| Investing Activities | ||||
| Additions of PP&E and Mineral Property, net of Long-Term Deposits | (138,704) | (39,859) | (246,793) | (55,035) |
| E&E Expenditures | (10,441) | (28,923) | (13,839) | (38,406) |
| Investment in Associate | (4,682) | – | (12,703) | – |
| Cash Used in Investing Activities | (153,827) | (68,782) | (273,335) | (93,441) |
| Financing Activities | ||||
| Shares Issued for Cash, net of Share Issue Costs | (97) | – | 314,613 | – |
| Replacement Options Exercised | – | 2,595 | 731 | 4,644 |
| Options Exercised | 497 | – | 1,474 | – |
| Repayment of Long-term Debt | (7,243) | (7,848) | (117,403) | (12,721) |
| Deferred Financing Fees | – | – | (58) | – |
| Other | (1,589) | 111 | (77) | 11 |
| Cash Provided by (Used in) Financing Activities | (8,432) | (5,142) | 199,280 | (8,066) |
| Effect on Foreign Exchange Rate Differences on Cash and Cash Equivalents | (3,090) | 1,306 | (8,300) | 6,120 |
| Increase (Decrease) in Cash and Cash Equivalents | (61,514) | 7,149 | 91,186 | 14,904 |
| Cash and Cash Equivalents, Beginning of the Period | 287,248 | 148,970 | 134,548 | 141,215 |
| Cash and Cash Equivalents, End of the Period | 225,734 | 156,119 | 225,734 | 156,119 |
Refer to Q2 2026 Financial Statements for accompanying notes
ENDNOTES
- These measures are non-IFRS financial measures. Refer to section “Non-IFRS Financial Performance Measures” for further information and a detailed reconciliation to comparable IFRS measures in the associated MD&A, filed on SEDAR+ at www.sedarplus.com under the Corporation’s profile.
- Additional details are available in the Unaudited Corporation’s Condensed Consolidated Interim Financial Statement and MD&A, filed on SEDAR+ at www.sedarplus.com under the Corporation’s profile.
- Amounts per share disclosed is calculated using the Basic Weighted Average Number of Common Shares for the period.
- Previously disclosed Free Cash Flow amount of $60,224,000 and $96,186,000 three and six months period ending June 30, 2025, which excluded the Investments in Long Term Inventories and Sustaining Exploration. Refer to section “Non-IFRS Financial Performance Measures” for further information.
- Capital Expenditures (Growth) includes Oko West Capital Expenditures in PP&E of $131,328,000 and E&E costs of $8,264,000 for the three months period ending June 30, 2026 (Oko West Capital Expenditures in PP&E of nil and E&E costs of $28,923,000 for the three months period ending June 30, 2025). Capital Expenditures (Growth) includes Oko West Capital Expenditures in PP&E of $219,844,000 and E&E costs of $13,839,000 for the six months period ending June 30, 2026 (Oko West Capital Expenditures in PP&E of nil and E&E costs of $38,406,000 for the six months period ending June 30, 2025).
- 2026 guidance assumes a realized gold price of $4,300 per oz, BRL/USD of 5.15 and CAD/USD of 1.40. 2027 guidance assumes a realized gold price of $4,000 per oz, BRL/USD of 5.55 and CAD/USD of 1.40.
- 2027 production guidance excludes production from Oko West.
- Comprises of costs that are not required to maintain the current level of production (where applicable) but are intended to materially improve, expand, or extend the life of the asset. It also includes exploration costs.
Photos accompanying this announcement are available at:
https://www.globenewswire.com/NewsRoom/AttachmentNg/6f26b215-1708-458d-bd34-f8803401377a
https://www.globenewswire.com/NewsRoom/AttachmentNg/7ccb3185-9694-4816-a6b6-5866d4e0d505
https://www.globenewswire.com/NewsRoom/AttachmentNg/c57046d8-7de1-4dbb-9abd-377e4d085e9a
https://www.globenewswire.com/NewsRoom/AttachmentNg/c415bbbb-8374-4025-85c1-89131109cdcb
https://www.globenewswire.com/NewsRoom/AttachmentNg/c4b02c93-fa5f-42c6-8081-08523a0c3026
https://www.globenewswire.com/NewsRoom/AttachmentNg/a232710a-7a3e-4aa4-93f3-544cf5e638d7