
Key findings from TransUnion report:
- Growth in new mortgages slowed significantly as affordability pressures persisted
- More Canadians fell seriously behind on payments year-over-year, with stress concentrated in Alberta, Saskatchewan and Ontario
- Consumer insolvency rates rose, driven primarily by non-mortgage holders
TORONTO, Aug. 25, 2026 (GLOBE NEWSWIRE) — Canadian consumer debt hit a record $2.64 trillion in the second quarter of 2026 as debt levels grew faster than the number of Canadians using credit, as existing borrowers carried larger balances than a year earlier, according to TransUnion’s Q2 2026 Credit Industry Insights Report (CIIR). Total outstanding balances grew $116.7 billion (+4.6%) year-over-year (YoY), while the number of Canadians with access to credit expanded more modestly to 32.5 million, a 1.1% YoY increase.
Total balance growth in Q2 2026 was highest among consumers at opposite ends of the risk spectrum. Super prime balances grew 6.5% YoY to $1.74 trillion, while subprime balances increased 5.9% YoY to $62.0 billion.
| Total Outstanding Credit Balances for All Products in Billions | |||||||||
| Q2 2025 | Q2 2026 | YoY Change | |||||||
| Super Prime | $ | 1,631.8 | $ | 1,737.2 | 6.5% | ||||
| Prime Plus | $ | 349.6 | $ | 353.9 | 1.2% | ||||
| Prime | $ | 273.1 | $ | 273.1 | 0.0% | ||||
| Near Prime | $ | 198.8 | $ | 202.2 | 1.7% | ||||
| Subprime | $ | 58.5 | $ | 62.0 | 5.9% | ||||
Credit limits and borrowing grew nearly at the same pace across all credit tiers. Credit limits for super prime consumers increased 6.4% YoY alongside a 6.5% rise in balances, while subprime consumers saw available credit grow 5.8% alongside a 5.9% balance increase. This suggests lenders continued to extend credit in both segments while borrowing levels remained relatively stable compared to credit limits.
While overall the credit market remained healthy in Q2 2026, the data suggests Canadians are experiencing increasingly different financial realities. Borrowing growth was strongest among consumers with the highest and lowest credit profiles, indicating that while some households expanded borrowing from a position of financial strength, others may have relied more heavily on credit to manage ongoing financial pressures.
Canadians with non-mortgage debt owed an average of $28,118 in Q2 2026, up 7.6% from a year earlier. Balances increased across all major lending product categories, led by auto loans (7.9%), lines of credit (7.4%), personal loans (7.1%) and credit cards (5.1%).
Average non-mortgage balances rose across nearly all credit tiers except subprime. Growth was strongest among prime plus and super prime consumers at approximately 5% YoY. While total balance growth including mortgages was strongest among consumers at both ends of the credit spectrum, growth in average non-mortgage balances was concentrated among lower-risk consumers.
| Average Non-mortgage Balance per Consumer | |||||||||
| Q2 2025 | Q2 2026 | YoY Change | |||||||
| Super Prime | $ | 30,663 | $ | 32,232 | 5.1% | ||||
| Prime Plus | $ | 25,655 | $ | 26,927 | 5.0% | ||||
| Prime | $ | 24,974 | $ | 26,124 | 4.6% | ||||
| Near Prime | $ | 23,054 | $ | 23,852 | 3.5% | ||||
| Subprime | $ | 19,225 | $ | 19,181 | -0.2% | ||||
“Credit growth in the second quarter reflected a widening divide across risk tiers. Super prime, prime plus and prime consumers continued to increase non-mortgage borrowing, while subprime consumers modestly reduced balances year over year, pointing to a more cautious borrowing environment among higher-risk households,” said Matt Fabian, senior director of financial services research and consulting at TransUnion Canada. “For lenders, this underscores the potential value of differentiated strategies: prudent expansion in lower-risk segments and close monitoring of subprime performance.”
Affordability Pressures Continued to Slow New Mortgage Activity
Canada’s mortgage market remained broadly stable in Q2 2026, but growth in new mortgages slowed noticeably. New mortgage origination increased 7.8% YoY, well below the double-digit growth seen in recent quarters, as affordability challenges, economic uncertainty and cautious consumer sentiment continued to dampen homebuying activity despite improving housing market conditions.
Canadians continued to carry larger mortgage balances in Q2 2026, even as fewer mortgages were outstanding overall. Total mortgage balances rose 3.9% YoY to $1.93 trillion, while the number of mortgage accounts declined slightly by 0.2%. The average outstanding mortgage balance increased 4.2% YoY to $293,270, suggesting that growth was driven by larger balances on existing mortgages, potentially stemming from higher loan amounts in prior years, mortgage renewals, and smaller legacy mortgages being paid off.
At the same time, new homebuyers were borrowing less. The average balance on newly issued mortgages fell 2.4% YoY to $354,683, suggesting affordability pressures influenced purchasing decisions and may have pushed some buyers toward lower-priced homes, larger down payments, or more affordable housing markets.
Despite ongoing affordability pressures, mortgage delinquencies remained low overall in Q2 2026, with 99.7% of mortgage holders making payments on time. However, the share of serious mortgage delinquency (60+ days past due) edged higher across all measures. Consumer-level serious delinquency rose 3 basis points (bps) to 0.29%, account-level rose 3 bps to 0.30%, and balance-level delinquency rose 6 bps to 0.31% YoY. The larger increase in balance-level delinquency indicated financial stress was becoming more concentrated among borrowers with larger mortgage balances.
Homeowners who took out new mortgages during the 2022–2023 period of rapidly rising interest rates continued to face greater affordability pressures and higher delinquency rates, particularly among the small segment of subprime borrowers. Mortgages originated in 2024 generally performed better, especially among subprime and near prime consumers. While overall mortgage delinquency rates edged higher in Q2 2026, the data continued to point to a resilient market, with financial stress concentrated among specific borrower segments rather than across homeowners more broadly.
Provinces Experiencing Mortgage Stress Differently
Mortgage payment trends continued to vary across the country in Q2 2026. While the national increase in mortgage delinquency remained modest, signs of financial stress were concentrated in provinces with higher housing costs and larger average mortgage balance, particularly Ontario and British Columbia. By contrast, several Prairie and Atlantic provinces remained stable or improved YoY.
Ontario experienced the largest YoY increase in account-level mortgage delinquency, rising 6 bps, followed by Prince Edward Island (5 bps) and British Columbia (4 bps). Alberta, Saskatchewan, Manitoba and Newfoundland and Labrador reported stable or improving results.
The differences were even more pronounced at the balance level. Ontario recorded the largest YoY increase in balance-level mortgage delinquency, rising 10 bps YoY. British Columbia followed with a 7 bps increase, reinforcing the trend that mortgage stress was more concentrated in higher-cost housing markets.
| 60 Days Past Due Delinquency Rates | ||||||
| Account-level mortgage delinquency | Balance-level mortgage delinquency | |||||
| Q2 2025 | Q2 2026 | Change bps | Q2 2025 | Q2 2026 | Change bps | |
| Canada | 0.26% | 0.29% | 3 | 0.25% | 0.31% | 6 |
| BC | 0.23% | 0.27% | 4 | 0.21% | 0.28% | 7 |
| AB | 0.32% | 0.31% | -1 | 0.22% | 0.23% | 1 |
| SK | 0.39% | 0.36% | -3 | 0.26% | 0.25% | -2 |
| MB | 0.36% | 0.34% | -1 | 0.21% | 0.22% | 1 |
| ON | 0.26% | 0.32% | 6 | 0.30% | 0.41% | 10 |
| QC | 0.22% | 0.22% | 0 | 0.18% | 0.17% | -1 |
| NB | 0.29% | 0.31% | 2 | 0.16% | 0.18% | 2 |
| NS | 0.30% | 0.30% | 0 | 0.15% | 0.17% | 3 |
| PEI | 0.24% | 0.28% | 5 | 0.13% | 0.17% | 4 |
| NL | 0.34% | 0.32% | -2 | 0.25% | 0.23% | -2 |
“Although mortgage delinquency rates remain low nationally, signs of credit stress are concentrated in higher-cost housing markets, where borrowers tend to carry larger mortgage balances and face greater exposure to affordability pressures and payment shocks,” said Fabian. “Provincial results suggest the recent rise in mortgage delinquencies is driven less by broad borrower distress and more by localized weakness in Canada’s most expensive markets, particularly Ontario and British Columbia.”
Most Canadians are Keeping Up with Payments, but More are Seeking Debt Relief
While most Canadians continued to keep up with their debt payments, a greater number turned to formal debt relief solutions in Q2 2026. Overall consumer credit performance remained broadly resilient, with national delinquency rates showing only modest change over the past two years. In fact, fewer consumers fell behind on payments compared to a year earlier, with the share of consumers 30+ days past due (DPD) declining to 4.27%, the lowest level observed over the past two years.
At the same time, the share of consumers who were in later stages of delinquency – 60+ and 90+ days past due – rose modestly above last year’s levels. However, delinquent consumers were generally not more likely to fall further behind than in previous periods.
Taken together, the data suggested that persistent financial stress remained concentrated among a relatively small segment of consumers rather than reflecting a widespread deterioration in credit quality.
| Consumer Delinquency by Stage | |||
| Consumers 30+ DPD | Consumers 60+ DPD | Consumers 90+ DPD | |
| Q2 2024 | 4.41% | 2.51% | 1.74% |
| Q2 2025 | 4.34% | 2.52% | 1.77% |
| Q2 2026 | 4.27% | 2.56% | 1.81% |
Beneath the stable national average, provincial results moved in different directions, highlighting uneven economic conditions across the country. The most significant deterioration in serious consumer delinquency (90+ days past due) was concentrated in Alberta, Saskatchewan, and Ontario, which together accounted for most of the upward pressure observed in the national delinquency rate. While fewer consumers entered delinquency nationally, a smaller group of financially stressed borrowers continued to struggle, suggesting an uneven recovery shaped by regional affordability pressures and slower household financial recovery.
Consumer 90+ DPD Delinquency by Province
| Q2 2025 | Q2 2026 | Y/Y change (bps) | |
| AB | 2.29% | 2.41% | 12 |
| NB | 1.96% | 1.98% | 1 |
| ON | 1.90% | 1.96% | 6 |
| NS | 1.92% | 1.91% | -1 |
| MB | 1.93% | 1.90% | -3 |
| SK | 1.78% | 1.89% | 10 |
| NL | 1.71% | 1.76% | 5 |
| PEI | 1.69% | 1.70% | 1 |
| BC | 1.68% | 1.67% | -1 |
| QC | 1.27% | 1.25% | -2 |
While delinquency rates remained relatively stable, more Canadians turned to formal debt relief solutions. The consumer insolvency rate rose to 1.10% in Q2 2026, up from 0.94% in Q2 2024, reaching the highest level observed over the past two years. Insolvency rates increased steadily over that time, suggesting more consumers were turning to formal debt relief after exhausting other options.
The rise in insolvencies was primarily driven by non-mortgage holders. Insolvency filing rates among non-mortgage holders have moved modestly above pre-pandemic levels, while rates among mortgage holders remained below their pre-2020 levels. This divergence indicates that financial stress isn’t being evenly distributed across the population as consumers without mortgages appear to be facing greater difficulty managing rising living costs and unsecured debt obligations, while homeowners have remained comparatively more financially resilient.
The composition of insolvency filings has remained largely unchanged despite growing overall volumes. Consumer proposals continued to account for nearly 80% of all filings, up from approximately 60% before the pandemic, while bankruptcies represented only about one-fifth of filings. This mix suggests the increase in insolvencies reflects consumers seeking structured debt restructuring solutions rather than a more broad-based deterioration in household finances.
“The gap between stable delinquency and rising insolvency is one of today’s more nuanced credit dynamics. On one hand, delinquency metrics suggest the market remains resilient; however, rising insolvency filings show that certain consumers, especially those without the asset buffer of homeownership, face growing financial pressure,” said Fabian. “The dominance of consumer proposals is somewhat reassuring, as it suggests more consumers are seeking debt restructuring rather than defaulting outright. The key question for the second half of 2026 is whether economic normalization can ease that pressure.”
Canada’s Credit Market Shows Signs of Stabilizing, but Momentum Remains Uneven
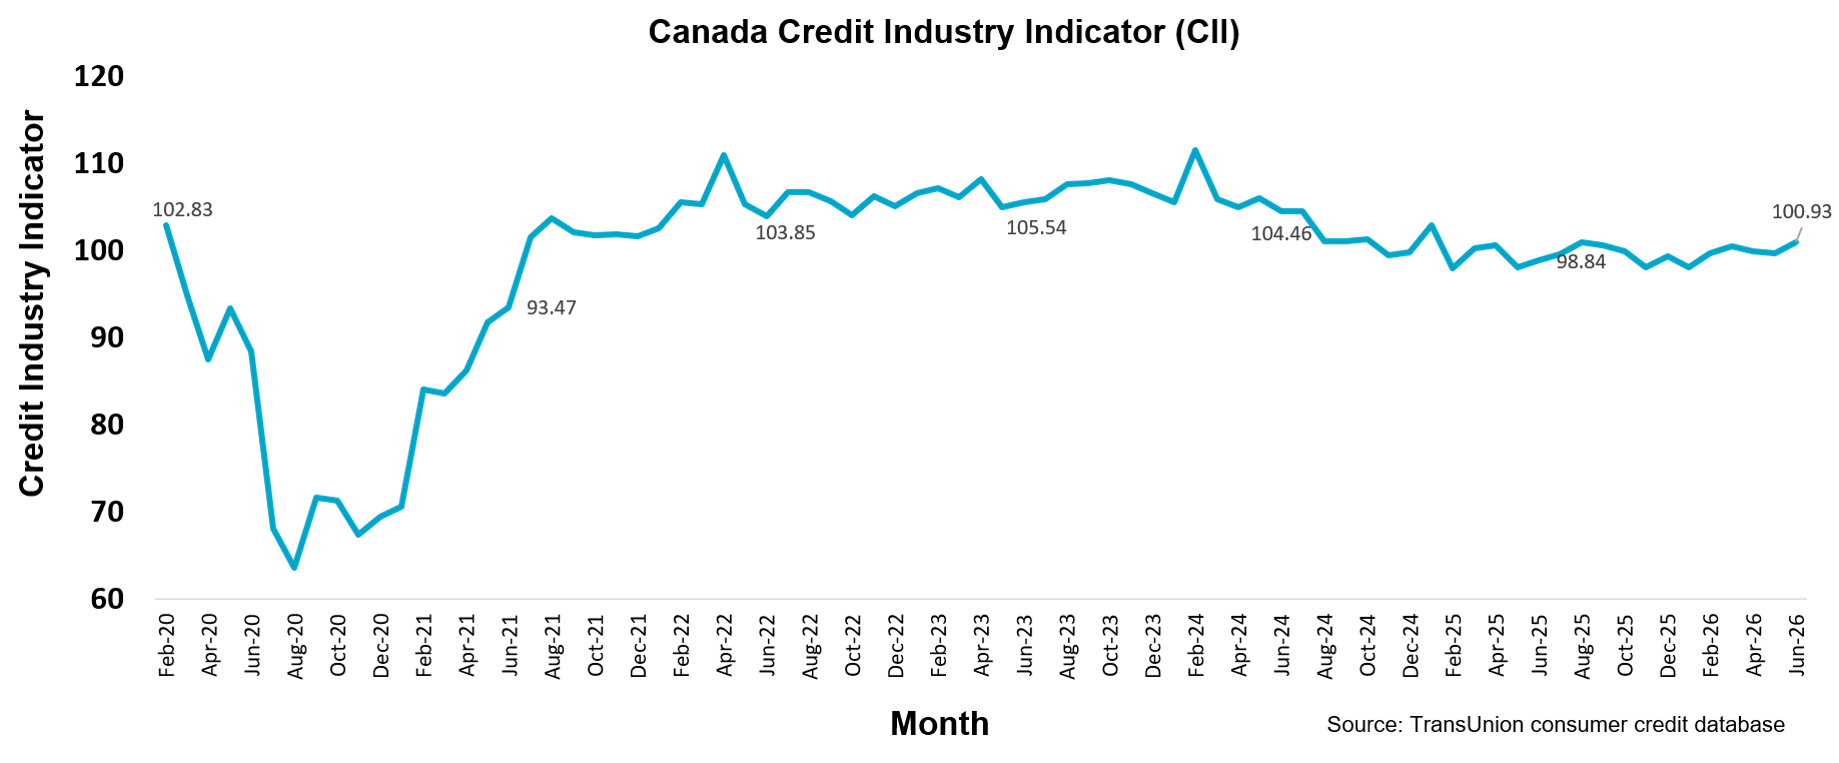
Canada’s Credit Industry Indicator (CII) rose to 100.9 in Q2 2026, up half a point from the previous quarter and two points from a year earlier. The modest increase suggests credit conditions are stabilizing rather than strengthening, as borrowing demand recovers and credit availability moves closer to balanced levels. Softer balance growth and uneven delinquency trends indicate the credit market has improved from the 2025 slowdown but remains below the stronger conditions seen in earlier expansionary periods.
About TransUnion (NYSE: TRU)
TransUnion is a global information and insights company with over 13,000 associates operating in more than 30 countries, including Canada, where we’re the credit bureau of choice for the financial services ecosystem and most of Canada’s largest banks. We make trust possible by ensuring each person is reliably represented in the marketplace. We do this by providing an actionable view of consumers, stewarded with care.
Through our acquisitions and technology investments we have developed innovative solutions that extend beyond our strong foundation in core credit into areas such as marketing, fraud, risk and advanced analytics. As a result, consumers and businesses can transact with confidence and achieve great things. We call this Information for Good® — and it leads to economic opportunity, great experiences and personal empowerment for millions of people around the world.
For more information visit: www.transunion.ca
For more information or to request an interview, contact:
Contact: Genevieve Grant
E-mail: [email protected]
An infographic accompanying this announcement is available at https://www.globenewswire.com/NewsRoom/AttachmentNg/b6a337ef-a46f-4f30-8047-241e39bfc28a
