
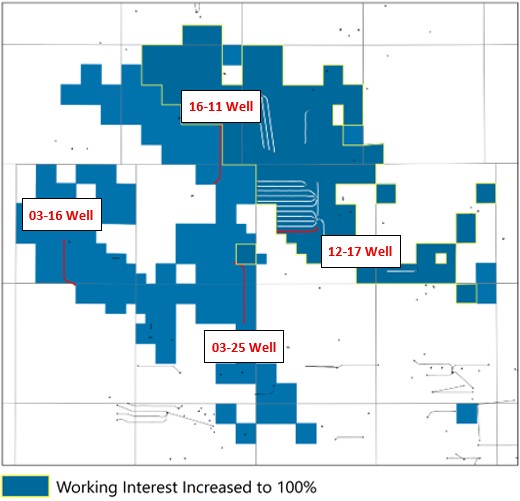
CALGARY, Alberta, Aug. 11, 2026 (GLOBE NEWSWIRE) — Bonterra Energy Corp. (TSX: BNE; OTCID: BNEFF) (“Bonterra” or the “Company”), a Calgary based oil and gas producer, is pleased to announce its financial and operating results for the three and six months ended June 30, 2026. Bonterra delivered record quarterly production of 16,828 barrels of oil equivalent (“BOE”) per day and funds flow of $32.9 million ($0.88 per fully diluted share). During the quarter, the Company brought three Charlie Lake wells on production, all which met or exceeded expectations, including two successful step-out wells that validated recently acquired acreage, expanded the Company’s future drilling inventory and supported an increase to its second-half production and capital program and guidance. Subsequent to the end of the quarter the Company completed a strategic tuck-in acquisition, which increased Bonterra’s working interest in its core Bonanza Charlie Lake position to 100% accelerating future development of the asset. The related unaudited condensed financial statements and management’s discussion and analysis (“MD&A”), are available on SEDAR+ at www.sedarplus.ca and on Bonterra’s website at www.bonterraenergy.com.
Highlights:
- Record Production averaged 16,828 BOE per day for the quarter
- Funds flow1 totaled $32.9 million ($0.88 per fully diluted share)
- Reduced Adjusted Net Debt by 2% during the quarter to $192.5 million despite an active capital program
- Three Bonanza Charlie Lake wells were brought on production, including two step-out wells that added areal expansion to the Company’s delineation program and further derisked go-forward drilling inventory
- Tuck-in acquisition increases working interest in Bonanza Charlie Lake property to 100%
- Wembley Montney delineation program progressed with a third well coming onstream
Patrick Oliver, President and Chief Executive Officer, stated: “This was a strong quarter across our portfolio, demonstrating our ability to effectively execute on our strategy. Bonanza Charlie Lake was a highlight as our step-out wells confirmed that the acreage we acquired in late 2025 extends beyond our core development area, adding approximately 20 derisked top tier locations to our growing inventory of high-quality, low-risk opportunities, and we backed that confidence by acquiring full working interest in our core development area. Our third Wembley Montney well also came onstream, advancing the delineation of that land base. Through capital efficiency, we grew production and cash flow while continuing to reduce debt, supporting our decision to raise both our production and capital guidance for the year.”
Financial & Operating Highlights
Production averaged 16,828 BOE per day during the second quarter of 2026, a record production quarter for the Company.
Funds Flow1 totaled $32.9 million ($0.88 per fully diluted share) in the second quarter of 2026 an increase of 43% compared to the same period in 2025 mainly driven by higher production and oil and liquids pricing.
Net Income totaled $20.7 million ($0.56 per fully diluted share) in Q2, inclusive of a $16.9 million unrealized hedging gain. H1 2026 net income totaled $6.1 million which included a $20.2 million unrealized hedging loss in Q1.
Field Netback and Cash Netbacks1 in Q2 2026 averaged $29.21 per BOE and $21.49 per BOE, respectively, inclusive of realized hedging losses in the quarter of $8.14 per BOE, with WTI crude oil prices averaging US$92.79 per barrel and AECO natural gas prices averaging $1.62 per mcf during the period.
Production costs averaged $16.47 per BOE in Q2 2026, remaining relatively unchanged compared to the same period in 2025.
Capital expenditures1 totaled $26.5 million in Q2 2026, supporting Bonterra’s strategy of expanding and delineating its Charlie Lake position while maintaining disciplined investment across its broader asset portfolio. Approximately 42% was directed to drilling, completion, equipping, tie-in and supporting infrastructure, primarily in the Charlie Lake play, 29% directed to land acquisition and facility maintenance capital, and the remaining 29% directed to drilling operations associated with the Company’s next round of wells in Cardium and Charlie Lake planned to come online in Q3.
Adjusted Net Debt1 totaled $192.5 million at the end of the second quarter of 2026, down $3.7 million from the first quarter of 2026, notwithstanding an active Q2 2026 capital program, resulting in an adjusted net debt to trailing twelve-month EBITDA ratio of 1.6:1, down from 1.9:1 in the previous quarter.
Financial and Operating Results
| Three months ended | Six months ended | ||||||
| As at and for the periods ended ($ 000s except for $ per share and $ per BOE) | June 30, 2026 |
June 30, 2025 |
June 30, 2026 |
June 30, 2025 |
|||
| FINANCIAL | |||||||
| Revenue – realized oil and gas sales | 97,227 | 64,185 | 163,650 | 134,875 | |||
| Funds flow (1) | 32,902 | 23,092 | 56,442 | 50,727 | |||
| Per share – basic | 0.91 | 0.63 | 1.56 | 1.37 | |||
| Per share – diluted | 0.88 | 0.62 | 1.52 | 1.35 | |||
| Cash flow from operations | 45,535 | 29,996 | 56,416 | 59,610 | |||
| Per share – basic | 1.26 | 0.81 | 1.56 | 1.61 | |||
| Per share – diluted | 1.22 | 0.80 | 1.52 | 1.58 | |||
| Net earnings (loss) | 20,688 | (1,313 | ) | 6,062 | (8,923 | ) | |
| Per share – basic | 0.57 | (0.04 | ) | 0.17 | (0.24 | ) | |
| Per share – diluted | 0.56 | (0.04 | ) | 0.16 | (0.24 | ) | |
| Capital expenditures | 26,474 | 6,351 | 64,470 | 38,801 | |||
| Total assets | 982,605 | 949,202 | |||||
| Adjusted net debt(2) | 192,473 | 171,027 | |||||
| Bank debt | 34,544 | 29,614 | |||||
| Shareholders’ equity | 527,791 | 530,935 | |||||
| OPERATIONS | |||||||
| Light oil | -bbl per day | 6,841 | 6,794 | 6,536 | 6,671 | ||
| -average price ($ per bbl) | 127.06 | 79.85 | 109.45 | 85.39 | |||
| NGLs | -bbl per day | 1,695 | 1,508 | 1,618 | 1,593 | ||
| -average price ($ per bbl) | 57.78 | 42.58 | 50.97 | 44.05 | |||
| Conventional natural gas | – MCF per day | 49,750 | 48,584 | 47,972 | 47,493 | ||
| – average price ($ per MCF) | 2.03 | 2.03 | 2.22 | 2.22 | |||
| Total BOE per day (3) | 16,828 | 16,399 | 16,149 | 16,179 | |||
(1) Funds flow, while not recognized under IFRS® Accounting Standards, is used by management to assess the Company’s ability to generate cash from operations. For these purposes, the Company defines funds flow as funds provided by operations including proceeds from sale of investments and investment income received excluding the effects of changes in non-cash working capital items and decommissioning expenditures settled.
(2) Adjusted net debt is not a recognized measure under IFRS Accounting Standards. The Company defines adjusted net debt as bank debt and subordinated notes plus current liabilities less current assets, excluding risk management contracts, the current portion of decommissioning liabilities and deferred consideration, and unamortized issue costs on subordinated notes.
(3) BOE may be misleading, particularly if used in isolation. A BOE conversion ratio of 6 MCF: 1 bbl is based on an energy conversion method primarily applicable at the burner tip and does not represent a value equivalency at the wellhead.
Operations Update
Bonanza Charlie Lake
Strong Drilling Results & Strategic Delineation Continue to Demonstrate Long Term Charlie Lake Potential
The Company executed an active drilling and development program in the second quarter bringing three (3.0 net) new wells on production. This included one development well within its core development area, the “12-17 well” which exceeded internal expectations achieving average 30-day peak rates of approximately 900 BOE per day consisting of approximately 515 barrels per day of light crude oil, 30 barrels per day of natural gas liquids and 2.1 mmcf per day of conventional natural gas. The Company also drilled and brought on production two step-out wells, the “03-16” well to the northwest and the “03-25” well to the southwest of its core development area.
The 03-16 well exceeded internal expectations achieving average 30-day peak rates of 1,000 BOE per day including approximately 515 barrels per day of light crude oil, 50 barrels per day of natural gas liquids and 2.7 mmcf per day of conventional natural gas.
The 03-25 well achieved average 30-day peak rates of approximately 475 BOE per day including approximately 265 barrels per day of light crude oil, 25 barrels per day of natural gas liquids and 1.1 mmcf per day of conventional natural gas. The well was initially brought on production during the first quarter before being temporarily shut in to facilitate facilities upgrades. Following the restart of production, the well exhibited a longer-than-expected ramp-up period and is expected to meet internal expectations as it continues to demonstrate competitive cumulative production relative to the Company’s other Bonanza Charlie Lake wells.
The Company is encouraged by the early results of its two step-out wells, validating the lands added in the Q4 2025 acquisition and derisking 20 top tier locations moving forward. Based on these encouraging results, the Company plans to accelerate infrastructure investments which will support its next planned Charlie Lake well, the “16-11” well, and future development plans in the area. In addition, the Company has elected to add an incremental well to its second-half 2026 capital program, planned to come onstream in the middle of the fourth quarter, in response to the strong performance of its first-half drilling campaign.
Net production from the Bonanza Charlie Lake asset in the second quarter was approximately 4,500 BOE per day2, representing 27% of total production in the quarter.
Strategic Tuck-in Acquisition Consolidates Charlie Lake Position
On August 10, 2026, the Company acquired all of the issued and outstanding shares of a private company with assets located in the Company’s Bonanza Charlie Lake area, for cash consideration of $4.6 million, subject to customary working capital adjustments. The acquisition consolidates Bonterra’s primary non-operated partner and increases the Company’s working interest across its Bonanza Charlie Lake position from approximately 90% to 100%. Full ownership is expected to simplify future planning, optimize full cycle development costs and provide greater operational flexibility across Bonterra’s core Charlie Lake development. Management expects the acquired assets to contribute approximately 315 BOE per day for the remainder of 2026 and add three net drilling locations.
Wembley Montney
Montney Well Delivers Encouraging Production Despite Operational Challenges
The Company’s third Montney well was completed with a three-mile lateral and approximately 300 successful fracture stimulation stages. During drilling and completion operations the well experienced operational challenges that required additional sand cleanout activities, extending the clean up period. Stabilized production levels have achieved average 120-day peak rates of approximately 800 BOE per day, including approximately 250 barrels per day of light crude oil, 110 barrels per day of natural gas liquids and 2.6 mmcf per day of conventional natural gas. Cumulative production to date totals approximately 38,350 barrels of light crude oil, 0.4 Bcf of conventional natural gas and 14,300 barrels of natural gas liquids. Notwithstanding the operational challenges experienced on the most recent well, the Company is pleased with the advancement of the delineation strategy of its Montney land base with further capital activity planned for 2027.
Net production from the Wembley Montney asset averaged approximately 1,315 BOE per day2 in Q2 2026, representing 8% of total Company production.
Updated 2026 Outlook
With the closing of the tuck-in acquisition and the successful first-half Bonanza Charlie Lake step-out program, the Company plans to accelerate infrastructure spending and drill one additional Charlie Lake well in the second half of 2026, planned to come onstream in the middle of the fourth quarter. Revised production and capital guidance for 2026 outlined below:
- Annual average production range increased to 16,600 to 16,800 BOE per day2 (from 16,200 to 16,400 BOE per day), weighted approximately 50 to 52% to oil and liquids; and
- Capital expenditure range, excluding acquisitions and divestitures, increased to $85 million to $90 million (from $75 million to $80 million).
The remainder of 2026 will see two new wells in the Bonanza Charlie Lake asset coming onstream and a targeted Pembina Cardium program coming onstream.
In response to commodity price volatility, Bonterra has continued to add oil, natural gas and foreign exchange hedges for the second half of 2026 and 2027. At June 30, 2026, the Company had hedged approximately 31% of forecast oil production, 23% of forecast natural gas production and 36% of forecast U.S. dollar exposure over the following nine months. Bonterra remains committed to managing leverage prudently, with debt reduction a priority for the remainder of 2026.
Notes Excluding Tables
(1) Non-IFRS measure. See advisories contained in this press release.
(2) See “Information Regarding Product Types” contained in this press release.
About Bonterra
Bonterra Energy Corp. (TSX: BNE | OTCID: BNEFF) is a Calgary-based oil and gas producer offering investors exposure to a portfolio of high-impact assets across three of Alberta’s premier light oil plays. Bonterra leverages the stable production and free cash flow of the Pembina Cardium — one of Canada’s largest oil plays — alongside the growth potential of the Bonanza Charlie Lake and Wembley Montney. Built on disciplined growth, capital efficiency, and steady debt reduction, Bonterra is positioned to deliver long-term, sustainable value to shareholders through commodity cycles. For more information, visit www.bonterraenergy.com or follow Bonterra on LinkedIn and X.
For further information please contact:
Bonterra Energy Corp.
Patrick Oliver, President & CEO
Scott Johnston, CFO
Telephone: (403) 262-5307
Fax: (403) 265-7488
Email: [email protected]
Cautionary Statements
This press release is a summary of Bonterra’s results for the three and six months ended June 30, 2026 and should be read together with the Company’s unaudited condensed financial statements and MD&A for the same period, which are available on SEDAR+ and at www.bonterraenergy.com.
www.bonterraenergy.com.
Non-IFRS and Other Financial Measures
In this press release, the Company refers to certain financial measures and ratios that are not standardized measures recognized under IFRS® Accounting Standards and may not be comparable with similar measures disclosed by other issuers. These measures include “funds flow”, “capital expenditures”, “adjusted net debt”, “adjusted net debt to EBITDA”, “field netback” and “cash netback” to analyze operating performance. Management uses these measures to assess operating performance, capital allocation, leverage and financial flexibility. See the reconciliations and descriptions below.
Funds Flow
Funds flow is a non-IFRS financial measure defined as cash provided by operating activities, adjusted to exclude changes in non-cash working capital and decommissioning expenditures settled, to replace finance costs with interest expense, and to include investment income received and proceeds on sale of investments, where applicable. Management considers funds flow useful in assessing the Company’s ability to finance capital expenditures, repay debt and meet other capital requirements.
The following is a reconciliation of funds flow to the most directly comparable IFRS measure, cash flow from operating activities:
| Three months ended | Six months ended | ||||||||
| June 30, 2026 |
June 30, 2025 |
June 30, 2026 |
June 30, 2025 |
||||||
| ($ millions) | |||||||||
| Cash flow from operating activities | 45.5 | 30.0 | 56.4 | 59.6 | |||||
| Adjusted for: | |||||||||
| Changes in non-cash working capital | (9.7 | ) | (4.7 | ) | (1.3 | ) | (5.4 | ) | |
| Interest expense | (4.3 | ) | (4.2 | ) | (8.7 | ) | (8.4 | ) | |
| Interest paid | 0.8 | 0.6 | 8.7 | 2.5 | |||||
| Decommissioning expenditures | 0.5 | 1.2 | 1.2 | 2.2 | |||||
| Investment income received | 0.1 | 0.2 | 0.1 | 0.2 | |||||
| Funds flow | 32.9 | 23.1 | 56.4 | 50.7 | |||||
Capital Expenditures
Capital expenditures are a non-IFRS financial measure representing exploration and evaluation expenditures and property, plant and equipment expenditures presented in the statement of cash flows.
| Capital Expenditures | |||||
| Three months ended | Six months ended | ||||
| June 30, 2026 |
June 30, 2025 |
June 30, 2026 |
June 30, 2025 |
||
| ($ millions) | |||||
| Comprised of: | |||||
| Exploration and evaluation expenditures | 0.3 | 0.2 | 1.6 | 0.4 | |
| Property, plant and equipment expenditures | 26.1 | 6.1 | 62.9 | 38.4 | |
| Capital Expenditures | 26.4 | 6.3 | 64.5 | 38.8 | |
Adjusted Net Debt and Adjusted Net Debt to EBITDA Ratio
Adjusted net debt is a non-IFRS financial measure calculated as bank debt and subordinated notes plus current liabilities less current assets, excluding risk management contracts, the current portion of decommissioning liabilities and deferred consideration, and unamortized issue costs on subordinated notes. EBITDA is a non-IFRS financial measure calculated as net earnings (loss), adjusted for unrealized risk management gains or losses, gains or losses on asset sales, deferred consideration, finance costs, share-based compensation, depletion and depreciation, exploration and evaluation expense, debt extinguishment and current and deferred income taxes. Adjusted net debt to EBITDA is a non-IFRS ratio calculated as adjusted net debt divided by trailing twelve-month EBITDA. Management uses these measures to assess leverage and financial flexibility. See Note 10 of the June 30, 2026 unaudited condensed financial statements.
The following is a summary of adjusted net debt and adjusted net debt to EBITDA and a reconciliation of trailing twelve-month EBITDA to the most directly comparable IFRS measure, “Net earnings (loss)”:
| ($ millions) | June 30, 2026 |
December 31, 2025 |
||
| Bank debt | 34.5 | 40.7 | ||
| Subordinated notes | 136.2 | 135.7 | ||
| Current liabilities | 60.6 | 43.5 | ||
| Current assets | (36.2 | ) | (40.9 | ) |
| Net debt | 195.1 | 179.0 | ||
| Risk management contracts | (1.3 | ) | 2.1 | |
| Decommissioning liabilities – current portion | (5.6 | ) | (5.5 | ) |
| Deferred consideration – current portion | (0.5 | ) | (0.8 | ) |
| Unamortized issue costs on subordinated notes | 4.7 | 5.2 | ||
| Adjusted Net Debt | 192.4 | 180.0 | ||
| Net loss | (2.1 | ) | (17.1 | ) |
| Adjustments to net loss: | ||||
| Unrealized loss (gain) on risk management contracts | 2.8 | (1.3 | ) | |
| Gain on sale of property | (1.1 | ) | (4.6 | ) |
| Deferred consideration | (0.7 | ) | (1.0 | ) |
| Finance costs | 22.3 | 22.3 | ||
| Share-based compensation | 2.6 | 2.5 | ||
| Depletion and depreciation | 92.5 | 101.6 | ||
| Exploration and evaluation | – | – | ||
| Extinguishment of debt | – | 11.6 | ||
| Current income tax recovery | (0.2 | ) | (1.7 | ) |
| Deferred income tax expense (recovery) | 0.7 | (3.0 | ) | |
| EBITDA (trailing twelve months) | 116.8 | 109.3 | ||
| Adjusted net debt to EBITDA ratio | 1.6 | 1.6 | ||
Field and Cash Netback
Field netback is a non-IFRS financial measure, calculated as revenue and realized risk management contract gain (loss) minus royalties and operating expenses divided by total BOEs for the period. Field netback per BOE is a non-IFRS ratio, calculated as field netback divided by total barrels of oil equivalent produced during a specific period of time. There is no comparable measure in accordance with IFRS. This metric is used by management to evaluate the Company’s ability to generate cash margin on a unit of production basis.
Cash netback is a non-IFRS financial measure, calculated as field netback less interest expense, general and administrative expense and current income tax expense divided by total BOEs for the period. Cash netback per BOE is a non-IFRS ratio, calculated as cash netback divided by total barrels of oil equivalent produced during a specific period of time. There is no comparable measure in accordance with IFRS. This metric is used by management to evaluate the Company’s ability to generate cash flow from continuing corporate activities on a unit of production basis.
Field and cash netback are calculated on per unit basis as follows:
| Three months ended | Six months ended | ||||||||
| June 30, 2026 |
June 30, 2025 |
June 30, 2026 |
June 30, 2025 |
||||||
| ($ millions) | |||||||||
| Oil and gas sales | 97.2 | 64.1 | 163.7 | 134.8 | |||||
| Realized gain (loss) on risk management contracts | (12.5 | ) | 0.5 | (16.6 | ) | 0.9 | |||
| Royalties | (14.8 | ) | (8.3 | ) | (22.1 | ) | (18.3 | ) | |
| Production costs | (25.2 | ) | (24.6 | ) | (49.1 | ) | (50.3 | ) | |
| Field Netback | 44.7 | 31.7 | 75.9 | 67.1 | |||||
| Office and administration | (1.7 | ) | (1.4 | ) | (2.7 | ) | (2.9 | ) | |
| Employee compensation | (2.4 | ) | (1.7 | ) | (4.9 | ) | (3.6 | ) | |
| Administrative and investment income | 0.1 | 0.1 | 0.1 | 0.3 | |||||
| Interest expense | (4.3 | ) | (4.2 | ) | (8.7 | ) | (8.5 | ) | |
| Current income (tax) recovery | (3.5 | ) | (1.4 | ) | (3.3 | ) | (1.7 | ) | |
| Cash Netback | 32.9 | 23.1 | 56.4 | 50.7 | |||||
| Barrel of oil equivalent (BOE) | 1,531,340 | 1,492,316 | 2,922,984 | 2,928,482 | |||||
| Field Netback ($ per BOE) | 29.21 | 21.28 | 25.95 | 22.93 | |||||
| Cash Netback ($ per BOE) | 21.49 | 15.47 | 19.31 | 17.32 | |||||
Information Regarding Product Types
References to natural gas and NGLs in this press release refer to conventional natural gas and natural gas liquids, respectively, as defined in National Instrument 51-101, Standards of Disclosure for Oil and Gas Activities. The Company’s average production for the six most recent quarters and references to light crude oil, NGLs and conventional natural gas consist of the product types shown below, using a conversion ratio of 6 Mcf of natural gas to one barrel of oil equivalent.
| 2026 | 2025 | |||||
| Q2 | Q1 | Q4 | Q3 | Q2 | Q1 | |
| Average daily production | ||||||
| Light oil (bbls/d) | 6,841 | 6,228 | 6,274 | 6,051 | 6,794 | 6,546 |
| NGLs (bbls/d) | 1,695 | 1,540 | 1,507 | 1,353 | 1,508 | 1,679 |
| Coventional natural gas (MCF/d) | 49,750 | 46,173 | 44,839 | 42,336 | 48,584 | 46,584 |
| Total (BOE/d) | 16,828 | 15,463 | 15,254 | 14,460 | 16,399 | 15,957 |
- 2026 annual average production, at the midpoint of the guidance range, is anticipated to be comprised of approximately 40% light crude oil, 11% NGLs and 49% conventional natural gas.
- Charlie Lake production for the Q2 2026 comprised approximately 38% light crude oil, 6% NGLs and 56% conventional natural gas.
- Montney production for Q2 2026 comprised approximately 33% light crude oil, 14% NGLs and 53% conventional natural gas.
Forward Looking Information
Certain statements contained in this release include statements which contain words such as “anticipate”, “could”, “should”, “expect”, “seek”, “may”, “intend”, “likely”, “will”, “believe” and similar expressions, relating to matters that are not historical facts, and such statements of our beliefs, intentions and expectations about development, results and events which will or may occur in the future, constitute “forward-looking information” within the meaning of applicable Canadian securities legislation and are based on certain assumptions and analysis made by us derived from our experience and perceptions. Forward-looking information in this release includes, but is not limited to: the Company’s revised 2026 financial and operating guidance relating to production and capital expenditures; the Company’s 2026 priorities and outlook; the expected results of our tuck-in acquisition, including the expected contribution to the Company’s production volumes; exploration and development activities; expectations relating to wells planned to come onstream; anticipated production by type; plans relating to repayment of indebtedness; oil and natural gas prices and demand; expansion and other development trends of the oil and gas industry; business strategy and outlook; expansion and growth of our business and operations; and other such matters.
All such forward-looking information is based on certain assumptions and analyses made by us in light of our experience and perception of historical trends, current conditions and expected future developments, as well as other factors we believe are appropriate in the circumstances. The risks, uncertainties, and assumptions are difficult to predict and may affect operations, and may include, without limitation: foreign exchange fluctuations; equipment and labour shortages and inflationary costs; general economic conditions; industry conditions; the impact on the Canadian energy industry of U.S. tariffs, changes to international trade agreements or the potential imposition of tariffs or other protectionist economic policies by the Canadian federal or provincial governments; applicable environmental, taxation and other laws and regulations as well as how such laws and regulations may limit growth or operations within the oil and gas industry; the impact of climate-related financial disclosures on financial results; the ability of the Company to raise capital, maintain its syndicated bank facility and refinance indebtedness upon maturity; the effect of weather conditions on operations and facilities; the existence of operating risks; volatility of oil and natural gas prices; oil and gas product supply and demand; risks inherent in the ability to generate sufficient cash flow from operations to meet current and future obligations; increased competition; stock market volatility; credit risks; climate change risks; cyber security; opportunities available to or pursued by us; and other factors, many of which are beyond our control. The foregoing factors are not exhaustive.
In addition, to the extent that any forward-looking information presented herein constitutes future-oriented financial information or financial outlook, as defined by applicable securities legislation, such information has been approved by management of the Company and has been presented to provide management’s expectations used for budgeting and planning purposes and for providing clarity with respect to the Company’s strategic direction based on the assumptions presented herein and readers are cautioned that this information may not be appropriate for any other purpose.
Actual results, performance or achievements could differ materially from those expressed in, or implied by, this forward-looking information and, accordingly, no assurance can be given that any of the events anticipated by the forward-looking information will transpire or occur, or if any of them do, what benefits will be derived therefrom. Except as required by law, Bonterra disclaims any intention or obligation to update or revise any forward-looking information, whether as a result of new information, future events or otherwise.
The forward-looking information contained herein is expressly qualified by this cautionary statement.
Frequently Recurring Terms
Bonterra uses the following frequently recurring terms in this press release: “WTI” refers to West Texas Intermediate, a grade of light sweet crude oil used as benchmark pricing in the United States; “MSW Stream Index” or “Edmonton Par” refers to the mixed sweet blend that is the benchmark price for conventionally produced light sweet crude oil in Western Canada; “AECO” is the benchmark price for natural gas in Alberta, Canada; “bbl” refers to barrel; “NGL” refers to Natural gas liquids; “MCF” refers to thousand cubic feet; “BCF” refers to billion cubic feet; “MMBTU” refers to million British Thermal Units; “GJ” refers to gigajoule; and “BOE” refers to barrels of oil equivalent. Disclosure provided herein in respect of a BOE may be misleading, particularly if used in isolation. A BOE conversion ratio of 6 MCF: 1 bbl is based on an energy conversion method primarily applicable at the burner tip and does not represent a value equivalency at the wellhead.
References in this press release to peak rates, initial production rates, test rates and other short-term production rates are useful in confirming the presence of hydrocarbons; however, such rates are not determinative of the rates at which wells will commence production or decline thereafter and are not indicative of long-term performance or of ultimate recovery. Readers are cautioned not to place undue reliance on such rates when evaluating aggregate production or future performance. Such results should be considered preliminary.
Numerical Amounts
All amounts in this press release are stated in Canadian dollars unless otherwise specified. The reporting and the functional currency of the Company is the Canadian dollar.
The TSX does not accept responsibility for the accuracy of this release.
A photo accompanying this announcement is available at https://www.globenewswire.com/NewsRoom/AttachmentNg/de78105e-201a-4933-9f05-8d58ac652c37
