

- Los Angeles Tops Congestion List in U.S., New York Remains America’s Slowest City
- Access the full report here: www.tomtom.com/Traffic–Index
AMSTERDAM, Netherlands, Jan. 21, 2026 (GLOBE NEWSWIRE) — TomTom (TOM2), the specialist in mapping and location technology, today releases the 15th edition of the TomTom Traffic Index, an annual analysis of global traffic trends and commuting behavior.
Based on mobility data in the year 2025, the TomTom Traffic Index measures congestion levels, average speeds and travel times per mile across the global road network*. The insights enable governments, businesses, media and drivers to better understand how traffic behavior is evolving and the impact of people and goods moving throughout the day.
Global Congestion Continues to Rise
For the first time, TomTom calculated global congestion levels by aggregating driving speeds over more than 2.2 trillion miles (3.6T km) driven worldwide. The results confirm a clear upward trend: global congestion has increased by 5 percentage points, rising from 20% to 25%.
Beyond driver frustration, increased congestion has serious societal implications. Rising levels of congestion globally lead to more emissions, higher fuel consumption, reduced productivity, and growing pressure on urban infrastructure. While traffic can be an indicator of economic boon, it can also hamper economies in and of itself.
U.S. Among Least Congested Countries in World
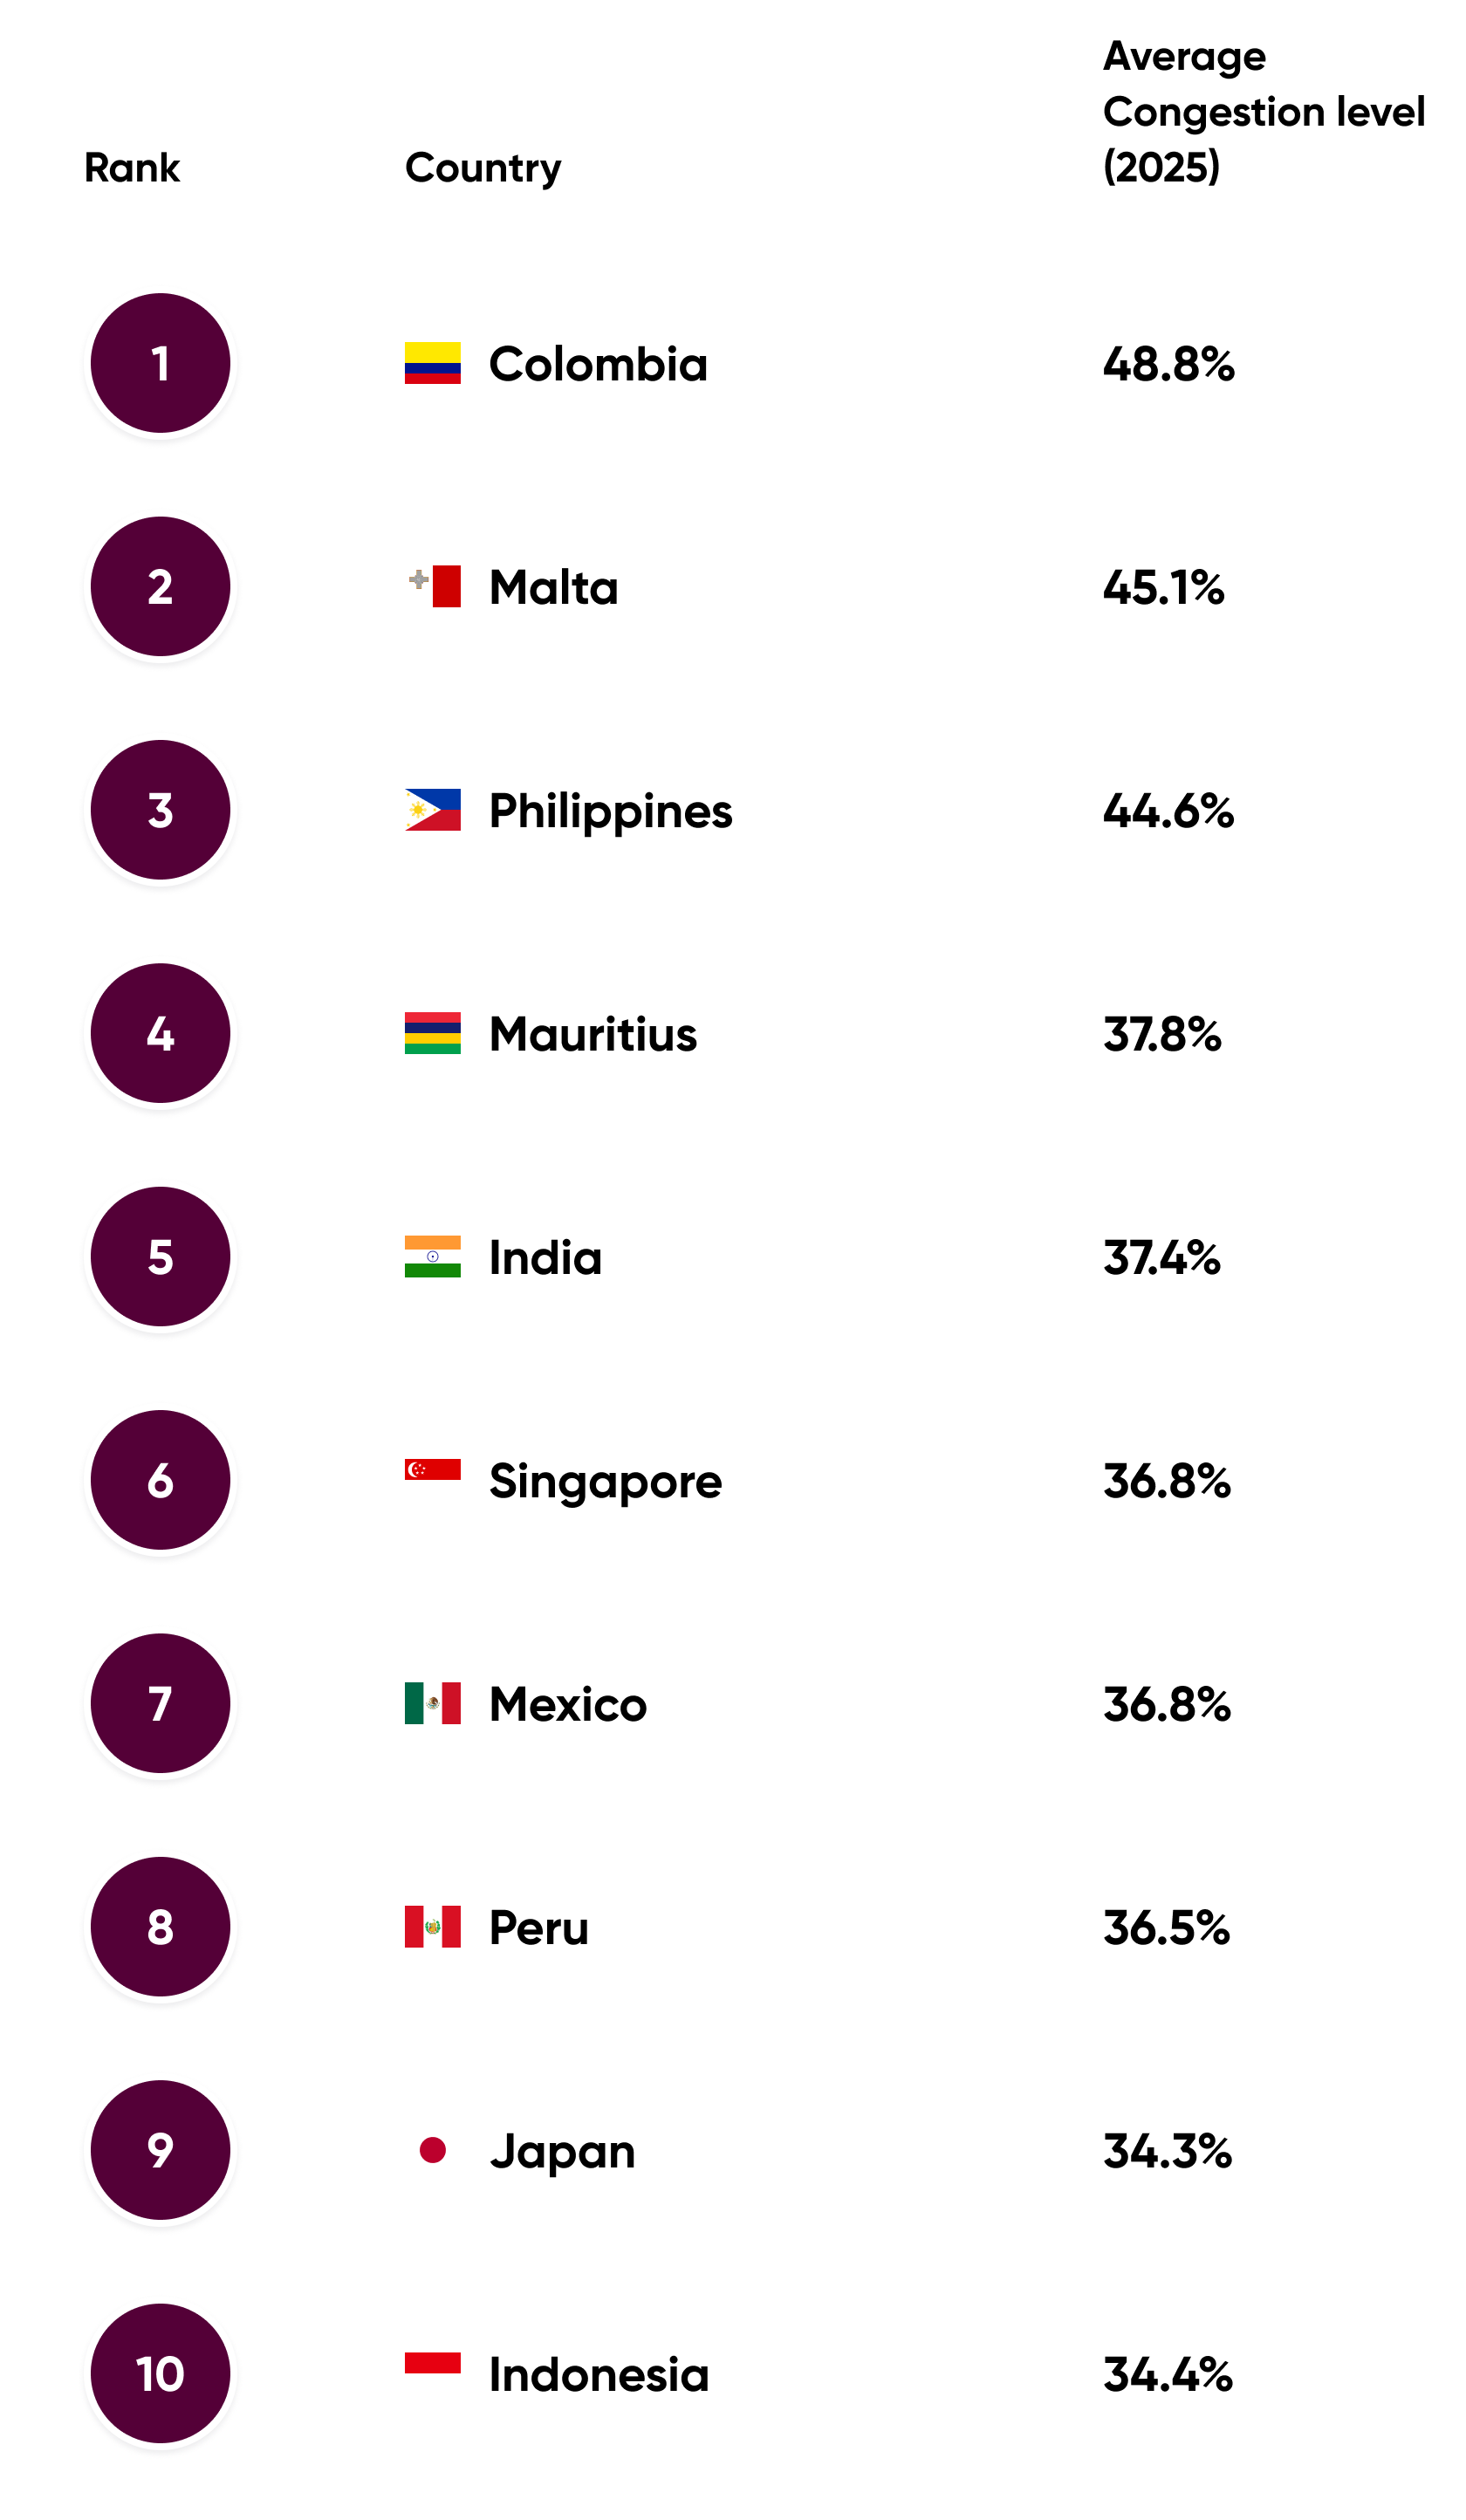
Despite having several large cities known for extreme traffic, the United States ranks among the least congested countries overall. In 2025, the U.S. placed 54th globally, with an average congestion level of 19%. By comparison, Colombia ranked 1st with an average congestion level of nearly 50%, Japan ranked 9th at 34%, the United Kingdom 23rd at 27%, and France 48th at 20%. The relatively low national congestion level reflects the scale and capacity of the U.S. road network and faster average travel speeds, and also the population density and urbanization of other countries.
Los Angeles Tops Congestion List, New York Remains America’s Slowest City
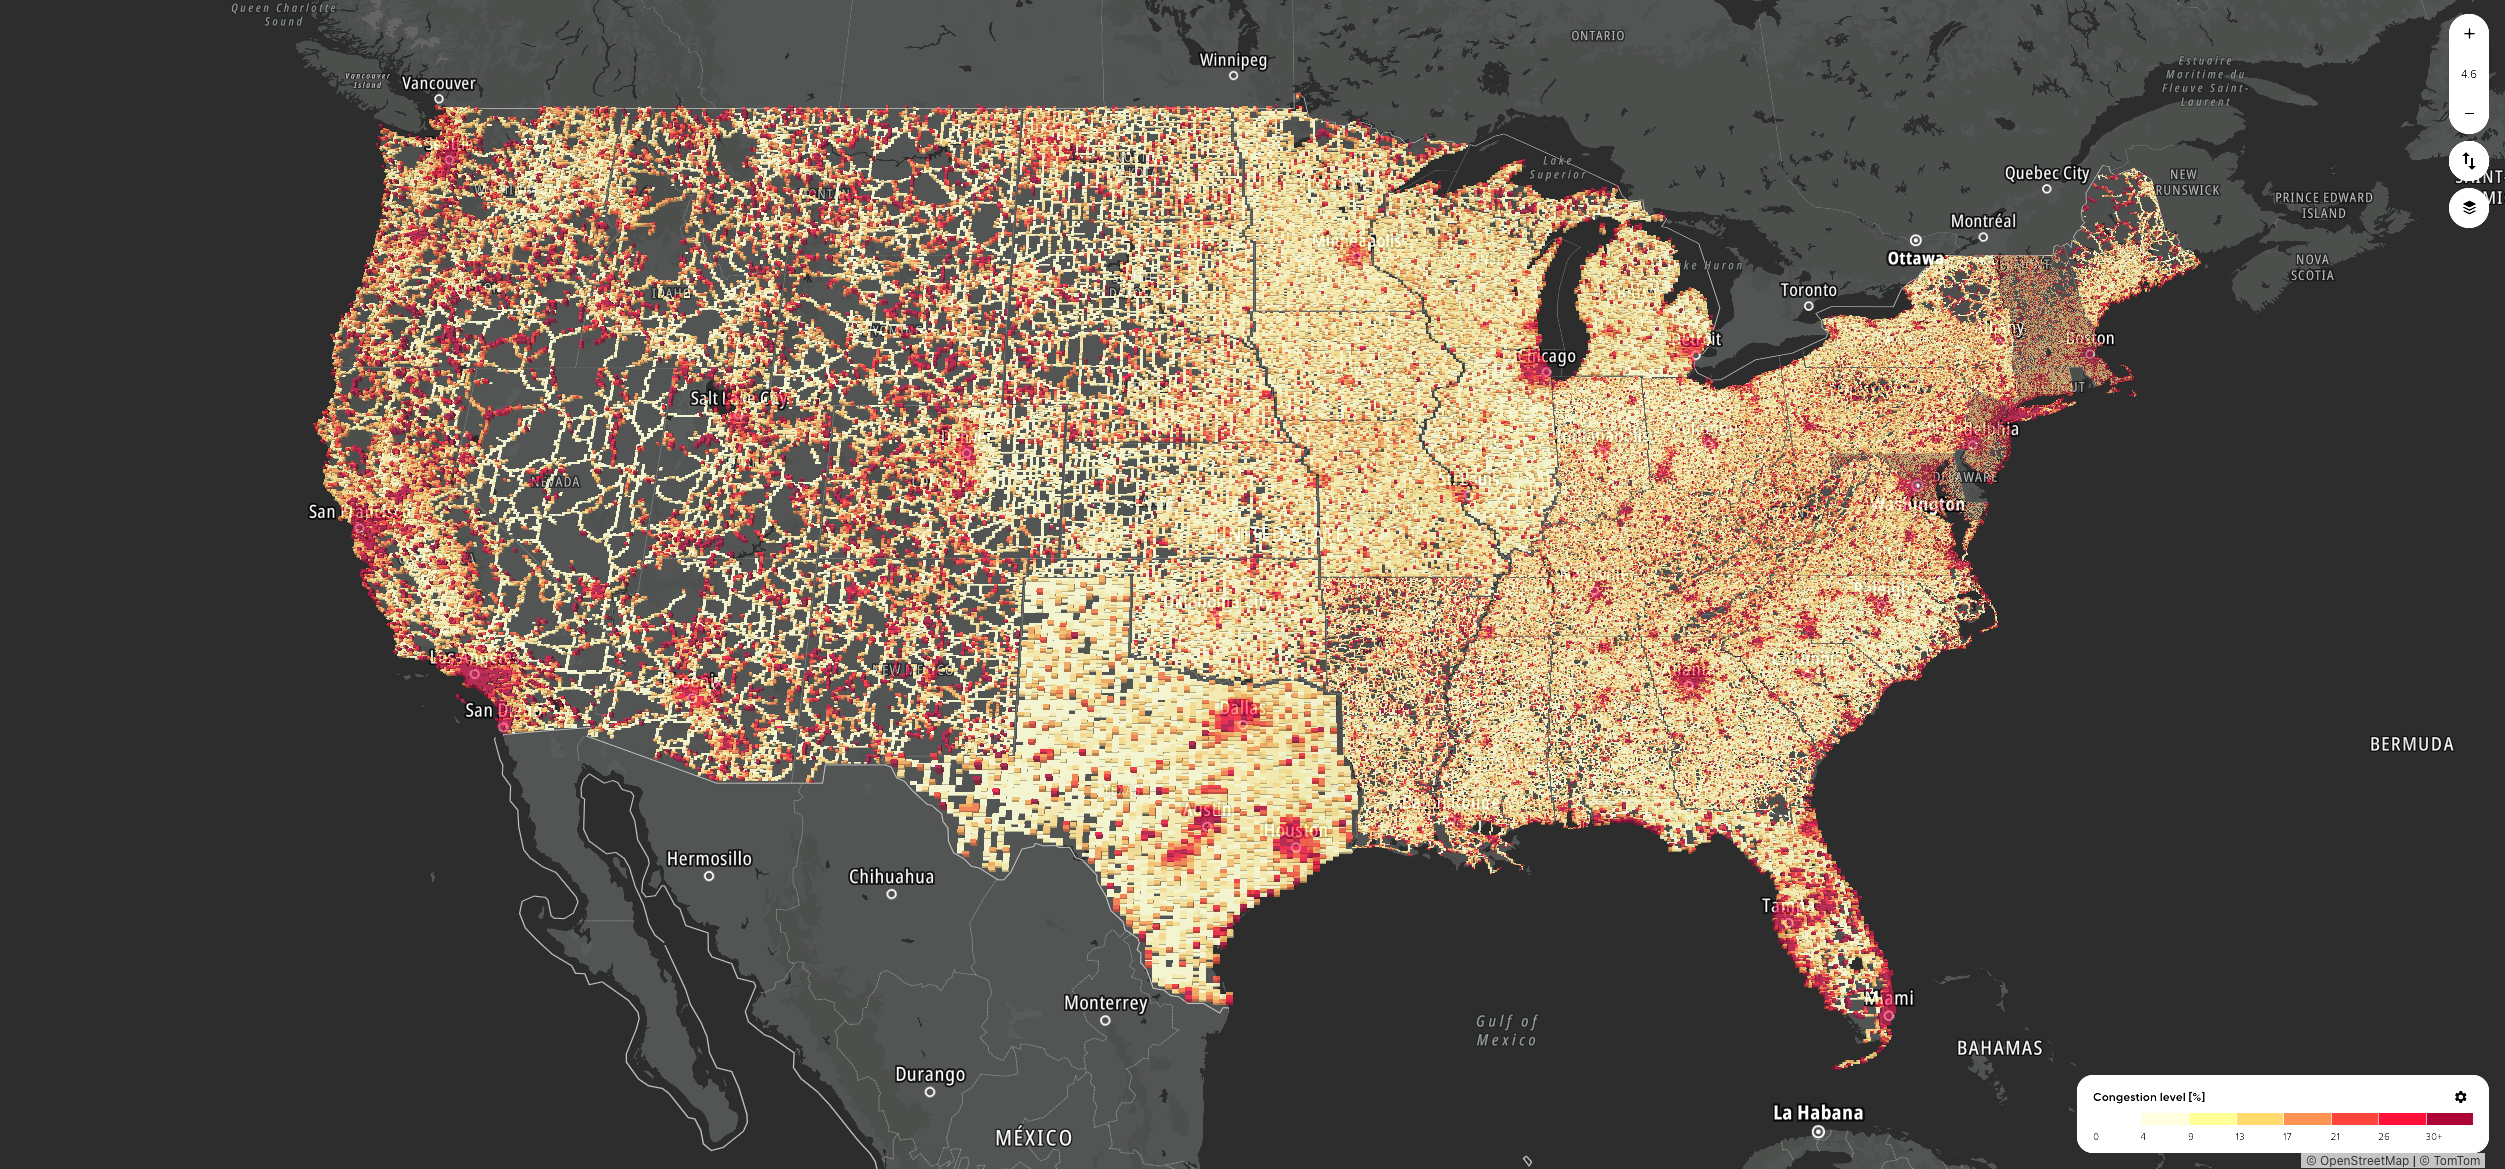
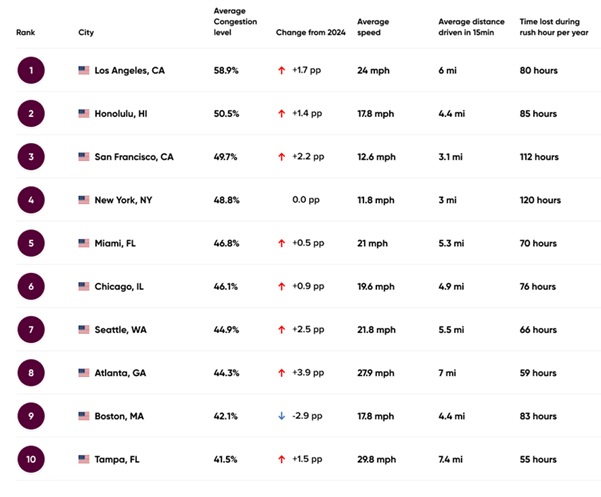
With nearly a 60% average congestion level, Los Angeles ranked as the most congested city in the U.S., followed by Honolulu, and San Francisco. Out of the top 10, Atlanta had the largest increase of four percentage points, while New York City stayed flat and Boston declined by three points. Overall, Americans experienced a four-point increase in traffic congestion compared to 2025.
New York remained the slowest overall city in the U.S. for a second year in a row, followed closely by San Francisco and distantly by Philadelphia and Honolulu. Based on a 6-mile commute driven during morning and evening peak hours, New Yorkers lost 120 hours to peak hour traffic in 2025, while Angelenos lost 80 hours. For comparison, drivers in Lima, Peru, in the most congested city in the world, lost nearly 188 hours in traffic.
Top 10 U.S. Cities with the Highest Congestion Levels
In 2025, commuting in the U.S. is no longer just about how many people are on the road – it’s about when they travel, where congestion concentrates, and how resilient the system is. New policies are reshaping traffic patterns in major cities, work-from-home norms continue to stretch and redistribute the traditional rush hour, and climate-driven disasters are increasingly testing the reliability of road networks.
Congestion Pricing Is Delivering Fewer Delays, Safer Streets
Although New York City’s overall congestion level remained flat compared to 2024, the first year of congestion pricing delivered clear, data-backed improvements on its busiest travel corridors. Major roads saw congestion fall by four percentage points year over year, with the most dramatic declines in Brooklyn (10 points) and Jersey City (eight points), though Upper Manhattan experienced a six-point increase. Peak-period traffic improved in late-morning (six points) and afternoon (nine points), improving bus efficiency entering Manhattan. Overall bridge performance improved citywide, with congestion dropping four points, led by the Williamsburg Bridge (22-point improvement), Manhattan Bridge (11 points), and Lincoln Tunnel (eight points). Weekly patterns also emerged, with Thursday ranking as the most congested day (41%), while weekends remained far smoother at 24–25%.
Local and secondary streets saw far smaller shifts, with congestion and average speeds remaining largely unchanged. However, New York City DOT reported safety outcomes within the congestion zone improved significantly: crashes dropped 14%, injuries fell 15%, and pedestrian fatalities reached their lowest levels since 2018. These findings suggest that while some traffic redistributed to local roads, the overall effect of congestion pricing has been strongly positive on the city’s core mobility network, improving performance on critical access routes and supporting early gains in transit ridership.
Rush Hour No Longer Has an Hour
Commuting in 2025 showed a clear reshaping of when people travel, even as overall congestion nearly returned to 2019 levels. Morning traffic shifted from a 7-9am peak to a more diffused pattern, with slightly lower congestion at 7–8am and a spillover into late morning. Mid-day and early-afternoon traffic (11am–3pm) is measurably higher than in 2019, pointing to more errand-running, flexible schedules, and hybrid work routines that spread demand outside traditional commute windows. Evening commuting patterns changed even more: instead of a sharp 5pm spike, congestion built earlier (3–4pm) and remained elevated through 6pm, resulting in overall slower PM speeds despite the flatter, more spread-out peak.
These shifts are even stronger when viewed through day-of-week and city-type lenses. By 2025, Tuesday–Thursday became the dominant commute days, while Monday nearly recovered to pre-COVID levels and Friday volumes fell – a strong indication of hybrid schedules clustering office days midweek. Tech-centric metros such as San Francisco, San Jose, Seattle, Austin, Boston, and Denver continue to lag 2019 delays and displayed the most pronounced midweek surges. In contrast, most other larger metros have surpassed 2019 congestion, especially during the evening commute period. Together, the data suggests that hybrid/remote work did not reduce commuting overall in 2025 but has fundamentally redistributed it – concentrating trips on select days and stretching the once-defined “rush hour” across a wider time period.
Extreme Weather Is Reshaping Road Performance and Reliability
Climate-related disasters are increasingly degrading U.S. road networks, with USDOT projecting that up to $20 billion per year will be spent on paved-road damage by 2030 due to heat, heavy rain, and coastal flooding. Weather also accounts for 15% of all non-recurring congestion, second only to traffic incidents. Recent natural disasters illustrate how quickly road conditions can unravel. The December 2025 Christmas floods in San Bernardino slowed highway speeds by 19% in Wrightwood and cut local road speeds by 22% in Lytle Creek. The December atmospheric river in the Pacific Northwest closed more than 300 roads and pushed congestion up 19% in parts of Seattle. It also created extreme chokepoints, most notably a 400% spike in congestion on I-5 during the SR-167 closure.
The transportation impacts extended well beyond the disaster periods. The July 2025 Texas Hill Country floods produced a 23% surge in congestion across all roads, with local streets hitting 51%. Even after two months, average speeds were still 7% below the prior year, highlighting the lasting effects of damaged infrastructure and slow recovery. Taken together, these events indicate that not only natural disasters cause immediate slowdowns but also drive prolonged detours, reduced travel speeds, and rising economic costs. It also underscores the growing urgency for resilient corridor design and adaptive routing strategies.
What Happens Next
Cities are dynamic ecosystems of movement, interaction, and innovation. Roads help facilitate movement within this ecosystem, whether it’s moving people, packages, or pizza. As cities grow denser and interconnected, residents will continue to face increasing strain from congestion, pollution, and inefficient transportation networks.
“As cities grow and adapt, we must address the multifaceted challenges that lead to increasing traffic congestion,” said Ralf-Peter Schäfer, Vice President for Traffic and Travel Information, TomTom. “The upward trend we see necessitates urgent action in smarter mobility planning, investments in public and shared transport, improved traffic management technologies, and coordinated policies. Our traffic data enables urban planners and policymakers to better understand these interconnected issues and make well-informed decisions that ensure cities remain livable, efficient, and sustainable in the face of growing congestion.”
For 15 years, the TomTom Traffic Index has provided a global view of mobility trends shaped by urban policies and driver behavior. The Traffic Index also serves as a critical benchmark for Departments of Transportation (DOTs), road authorities, and city planners to make cities smarter, more efficient, and more sustainable.
About the TomTom Traffic Index
The 15th edition of the TomTom Traffic Index is our most robust and complete analysis ever. The Index benchmarks cities on their congestion levels, travel times and speeds, based on worldwide trip data spanning more than 3.65 trillion km, providing access to traffic information city by city. TomTom Traffic Index insights help state, regional and federal governments, DoTs, city planners and decision makers tackle traffic challenges and develop future-shaping strategies.
For the first time, all data from the cities included in the Traffic Index can now be accessed through the new TomTom Area Analytics tool, launched last month. Users can select any city or define a custom area and analyze traffic across specific days, months, or years, with detailed hourly breakdowns for deeper insight into mobility trends. From neighborhoods to entire countries, the tool quickly delivers detailed insights into congestion levels, travel speeds, and free-flow conditions, helping users better understand how mobility evolves over time and providing one of the world’s most comprehensive views of road and traffic performance.
Download the full report here.
*Note to editors: Data covers all countries where reliable traffic information is available. Certain territories, including countries in active conflict situations and regions such as China where data access is restricted, are excluded for ethical or availability reasons.
About TomTom:
Billions of data points. Millions of sources. Hundreds of communities.
We are the mapmaker bringing it all together to build the world’s smartest map. We provide location data and technology to drivers, carmakers, businesses, and developers. Our application-ready maps, routing, real-time traffic, APIs, and SDKs enable the dreamers and doers to shape the future of mobility.
www.tomtom.com
For further information:
Media Relations
[email protected]
Investor Relations
[email protected]
Photos accompanying this announcement are available at:
https://www.globenewswire.com/NewsRoom/AttachmentNg/66582560-fcda-4907-9676-ca33ed8a3368
https://www.globenewswire.com/NewsRoom/AttachmentNg/a4521b27-2f4e-4031-ac10-f50b68618e8a
https://www.globenewswire.com/NewsRoom/AttachmentNg/953465ef-1abb-440b-aebc-89e6bc04e63e
https://www.globenewswire.com/NewsRoom/AttachmentNg/cca407ce-eff7-4986-84c8-79219a91cdc1
