
LONDON, Dec. 12, 2025 (GLOBE NEWSWIRE) — Advanced data visualization technology by SciChart is seeing record use across Formula 1 (F1), where it now supports most of the sport’s telemetry, simulation and engineering workflows either directly or indirectly.
With F1 increasingly driven by a software-first engineering philosophy, high-performance GPU-accelerated visualization has become essential for applications across the grid. Deployments include pit-wall telemetry, remote operations, simulation-to-track correlation, power-unit development, ECU analysis, tyre performance modelling and wind-tunnel data interpretation.
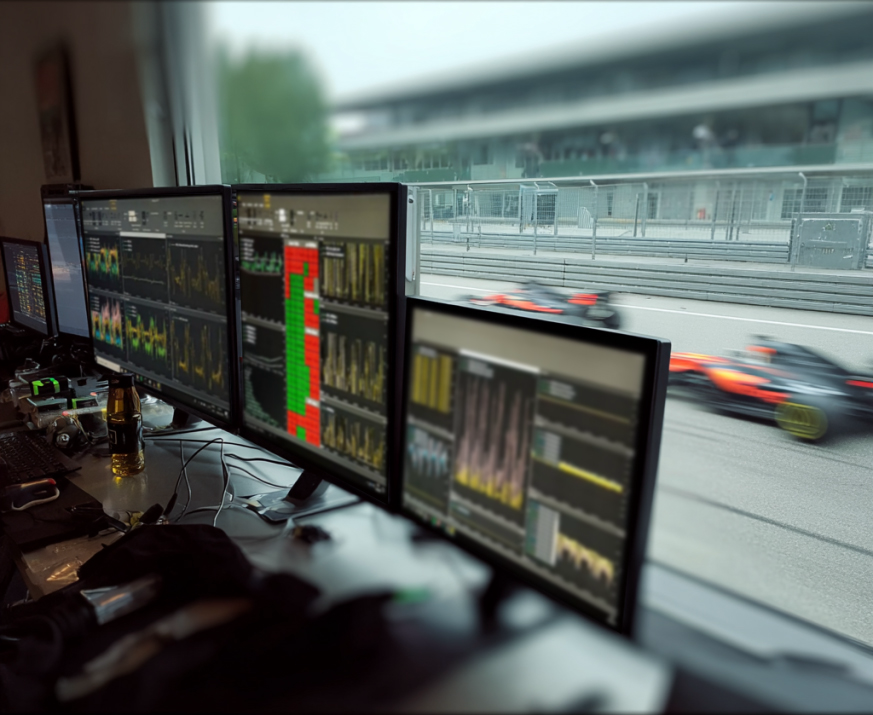
These workflows rely on extremely high-frequency datasets where engineers must extract precise insights in real time.
SciChart has also been selected by a future manufacturer’s program in advance of public entry, an indication of how new entrants are investing in software-first engineering infrastructure long before debuting a car.
Under the Cost Cap, Software Becomes the New Performance Frontier
Formula 1’s financial regulations have shifted competitive advantage toward computational capability: simulation efficiency, rapid interpretation of high-frequency sensor data and the ability to correlate disparate datasets with precision.
With physical development restricted, performance gains increasingly come from stronger software pipelines rather than additional hardware.
This shift has driven demand for visualization engines capable of extremely low latency, stable rendering under high data load and full numerical precision – capabilities essential for engineers making split-second decisions during live race sessions.
Teams are increasingly replacing older visual layers with modern GPU-accelerated engines built for high frequency engineering applications.
“Under the cost cap, performance is no longer only mechanical, it’s computational. Formula 1 teams need to extract maximum insight from every sensor, every lap and every simulation,” said Andrew Burnett Thompson, Founder and CEO of SciChart.
Real-Time Visualization Drives Modern F1 Live Data Analysis
Contemporary F1 environments involve hundreds of sensor channels sampled at high rates, strict timing constraints and multi-disciplinary data that must be interpreted instantly. Real-time correlation across aero, chassis, power-unit and driver-input data has become fundamental to both trackside operations and remote engineering rooms.
Modern rendering engines are designed to process large, fast-moving datasets without downsampling, frame drops or numerical artifacts. This enables engineers to examine transient behaviors, often lasting only milliseconds, without loss of signal integrity. In production systems, single visualizations may involve tens of millions of data points displayed without lag.
The technology is now used across live telemetry dashboards, simulation-to-track correlation workflows, wind-tunnel analysis, power-unit test environments and a variety of commercial toolchains. As teams blend internal development with proven external components, the visual layer has become a key part of their software ecosystems.
Growing Demand for High Precision Insight
Growth in motorsport has been fueled by the rising reliance on software-driven engineering. Other contributing factors include the need to visualize increasingly complex telemetry environments, and long-term programs from both existing teams and new manufacturers. Broader engineering trends, including heavier reliance on simulation, correlation loops and sophisticated sensor fusion, continue to expand the need for high precision, real-time visualization.
“The engineering culture in Formula 1 is evolving. Teams are building more of their own software and relying on visualization that is instantaneous, reliable, and exact. Our momentum reflects that shift, and the fact that our technology is now used across the grid, whether through internal systems or external platforms, shows how central real-time visualization has become to modern race engineering,” said Sheldon Vestey, Chief Commercial Officer at SciChart.
Proven in Extreme Environments, Applied to Industry
The same rendering technology used in Formula 1 is now foundational in other sectors facing similar real-time data challenges, including low latency decision cycles, multi-signal correlation and the requirement for numerical precision at scale.
Industries include: electric vehicle and battery thermal engineering, powertrain development, aerospace sensor fusion and simulation platforms, defense and radar visualization environments, and industrial test rigs and operational monitoring systems.
Formula 1’s high pressure, data intensive environment has become a proving ground for the visualization technologies now shaping next generation engineering across multiple industries.
About SciChart
SciChart is a high-performance data visualization charting library used globally in scientific research, financial trading, aerospace, defense, automotive engineering and advanced industrial systems. Available across Windows WPF, JavaScript WebGL and Mobile iOS, Android, SciChart enables real-time rendering of large and complex datasets with GPU acceleration and high numerical precision. Its technology powers mission critical systems for Fortune 500 companies, pioneering engineering teams and national research programs worldwide.
For more information, visit www.scichart.com.
Photos accompanying this announcement are available at:
https://www.globenewswire.com/NewsRoom/AttachmentNg/8d8f31e0-0730-4c4c-9c80-a4785bfc02e6
https://www.globenewswire.com/NewsRoom/AttachmentNg/04a302b8-51f3-46dd-876c-785f9d662237
